Economic growth and the environment at Higher Level: This page looks at the environment through the lens of economics. It asks how economic growth harms and helps environmental welfare, with Beijing's air as the main example.
Practise this as you read
- Outline how economic growth can harm and help the environment.
- Explain the environmental Kuznets curve and its limits.
- Discuss who pays the environmental cost of rising consumption.
Free preview
This is the free notes preview
You're reading the free notes. Aimnova Pro unlocks the full study experience — and you can try it with your first topic free to keep:
- FlashcardsLock in vocabulary and key terms with spaced repetition.
- Practice questionsAnswer exam-style questions and get instant AI marking.
- Mock exams & past-paper vaultSit full mocks and see exactly how examiners award marks.
- Personalised study planA daily plan built around your exam date and weak areas.
Growth changes the environment, both ways: economic growth means more is made, bought and used. It changes environmental welfare: it can damage nature, and it can pay to protect it.
Growth and environmental welfare
- Economic growth = more goods and services made and bought each year (rising GDP).
- Growth raises incomes, and incomes change how people use the environment.
- The effects on environmental welfare go both ways: harm and help.
- Harm: more resources used, more pollution, more warming, less habitat.
- Help: money and technology to protect nature and clean up pollution.
- Who gains and who suffers is a question of environmental justice.
Real example: China's economy grew by about 10% a year from 1990 to 2013. Its cities' air became some of the dirtiest in the world; then, as people grew richer, the same cities began to clean it up.
Feeling unprepared for exams?
Get a clear study plan, practice with real questions, and know exactly where you stand before exam day. No more guessing.
Growth needs energy, land and materials. Most of the extra comes from non-renewable resources and from cleared natural land.
How growth can harm the environment
- More non-renewable resources used: oil, coal, metal ores.
- More pollution from factories, power stations, cars and farms.
- More greenhouse gases, so more global warming.
- Natural habitats lost to mines, farms, roads and cities, so biodiversity falls.
- Driven by short-term profit and weak laws that leave damage uncosted.
Pollution: Beijing, 2013
Fast growth ran on coal. In 2013 Beijing's yearly average PM2.5 was 89.5 micrograms per cubic metre, more than twice China's own standard of 35.
Habitat loss: Indonesia's palm oil
Rising world demand for cheap palm oil cleared rainforest in Borneo and Sumatra for plantations, a major cause of the orangutan's loss of habitat.
Habitat loss: the Amazon
Forest is cleared for cattle pasture, soy fields and gold mines that supply world markets. The market pays for beef and soy, not for the carbon the forest stores.
Remember it as: More made means more taken, more burned, more thrown away.
Growth can also pay for a cleaner environment. Beijing shows how fast PM2.5 fell once the country could afford to act.
How growth can help the environment
- Richer people demand a cleaner environment and vote for it.
- Governments can afford laws, inspectors, parks and clean-up.
- Firms can invest in cleaner technology: filters, gas or renewables instead of coal.
- The economy shifts from heavy industry to services, which pollute less.
- Some growth depends on nature: ecotourism earns money only while wildlife survives.
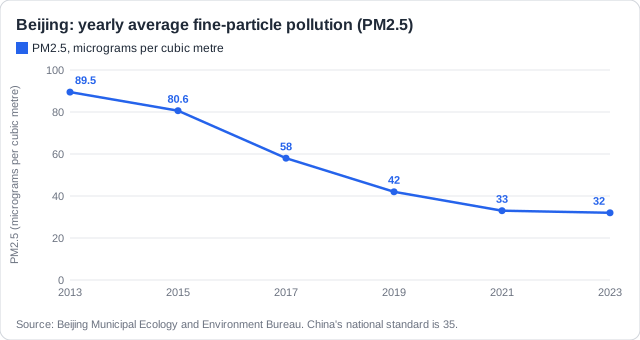
What paid for it: A national action plan from September 2013 set targets for each city. Coal boilers were swapped for gas and electric heating, and Beijing closed its last large coal power station in 2017.
Two more places: London cut its smoke after the deadly 1952 smog with the Clean Air Act of 1956. Costa Rica has paid landowners to keep their forest standing since 1997.
Memorize terms 3x faster
Smart flashcards show you cards right before you forget them. Perfect for definitions and key concepts.
Economists sum up s2 and s3 in one picture, the environmental Kuznets curve. It is a model: useful, but it does not fit every kind of damage.
The Kuznets curve and its limits
- The environmental Kuznets curve: pollution rises, peaks, then falls as income per person grows.
- It fits local pollutants people can see and breathe: smoke and sulfur dioxide.
- It fits carbon dioxide, waste and biodiversity badly: they often keep rising.
- Some fall only because dirty industry moves abroad to pollution havens.
- Some damage cannot be undone: an extinct species does not come back when income rises.
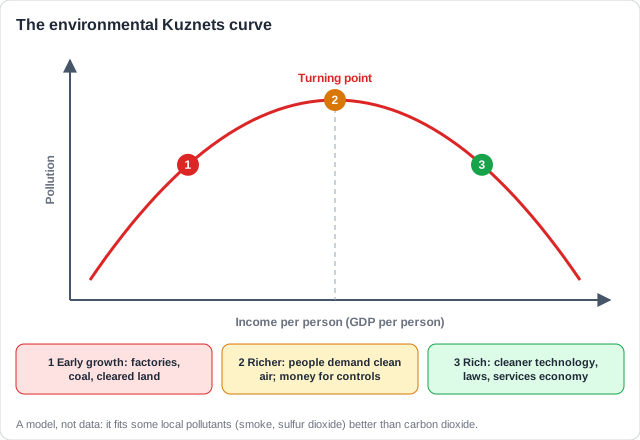
Do not overclaim: Beijing fits the curve for smoke. But China's carbon dioxide kept rising, and some rich countries are cleaner partly because factories moved to pollution havens.
The guide adds a hard question: when growth raises consumption, who bears the cost? This is environmental justice.
Growth and environmental justice
- The benefits of growth (goods, jobs, profit) and its costs (pollution, lost land) fall on different people.
- The richest 10% of people cause about half of the emissions from consumption.
- The poorest often live next to the mines, dumps and dirty factories.
- Rich countries can export waste and pollution to poorer ones.
- So even 'cleaner' growth can be unjust: ask who pays the environmental cost.
Agbogbloshie, Ghana: Much e-waste from rich countries ended up at this scrapyard in Accra. Workers, some of them children, burned cables to recover copper and breathed the smoke. The site was cleared in 2021.
Who gains
- Buyers of new phones and laptops
- Firms that sell them
- Countries that export waste
Who pays
- Workers burning cables
- Families breathing the smoke
- Local soil and water
Know your predicted grade
Take timed mock exams and get detailed feedback on every answer. See exactly where you're losing marks.
How it is asked: May 2026 HL Paper 2 asked: to what extent is biodiversity loss driven by economic development? [9]. Expect the same shape for pollution, warming or habitats: weigh growth's harm against what growth pays for, with named examples, then judge.
Between 1990 and 2023 China's economy grew faster than almost any other.
To what extent does economic growth damage environmental welfare?
Model answer plan
See the mark-by-mark plan — for / against / judgement, with marking guidance — in study mode.