Growth, supply and demand at Higher Level: This statement belongs to the HL lens on environmental economics. It shows how markets drive economic growth, why growth is taken as a sign of success, and what the market leaves out.
Practise this as you read
- Explain how supply and demand drive economic growth.
- Outline why growth is perceived as a measure of prosperity.
- Explain why a linear economy leads to environmental degradation, using fast fashion or avocados.
Free preview
This is the free notes preview
You're reading the free notes. Aimnova Pro unlocks the full study experience — and you can try it with your first topic free to keep:
- FlashcardsLock in vocabulary and key terms with spaced repetition.
- Practice questionsAnswer exam-style questions and get instant AI marking.
- Mock exams & past-paper vaultSit full mocks and see exactly how examiners award marks.
- Personalised study planA daily plan built around your exam date and weak areas.
Prices bring buyers and sellers together: Markets work through demand and supply. The price changes until they meet.
The points to remember
- Demand: how much people want to buy at each price.
- Supply: how much producers will sell at each price.
- When demand rises faster than supply, the price rises.
- A higher price makes producers supply more: more land, workers, machines.
- When supply rises (cheaper ways to produce), prices fall and people buy more.
Remember it as: More wanted, higher price, more made.
Demand rises
- Since 2000 people in the USA have eaten far more avocados.
Price rises
- An avocado orchard now earns much more than maize or forest.
Supply rises
- Farmers in Michoacan plant more orchards to sell more.
Hidden cost
- Pine-oak forest is cleared and streams run low.
Never wonder what to study next
Get a personalized daily plan based on your exam date, progress, and weak areas. We'll tell you exactly what to review each day.
Add up all the extra goods made and sold to meet demand, and you get economic growth.
How supply and demand drive growth
- More demand leads to more production of goods and services.
- More production means GDP rises: economic growth.
- New technology and resources raise supply, which also drives growth.
- Growth is influenced by supply and demand, not planned by nature's limits.
Demand side
More people, or richer people, want more phones, cars and food.
Supply side
New machines, cheap energy and new resources let firms make more for less.
Result
More is produced and sold, so GDP rises: economic growth.
Economic growth is often treated as a sign of prosperity: a richer country is assumed to be a better-off country.
Growth seen as prosperity
- Growth is often perceived as a measure of prosperity.
- It brings jobs, higher incomes and more taxes for schools and hospitals.
- So governments aim for growth every year.
- Real example: since 1978 China's fast growth has lifted over 800 million people out of extreme poverty.
Perceived, not proven: The guide says growth 'may be perceived' as prosperity. More goods do not always mean better lives, especially when the environment pays the price.
Stop wasting time on topics you know
Our AI identifies your weak areas and focuses your study time where it matters. No more overstudying easy topics.
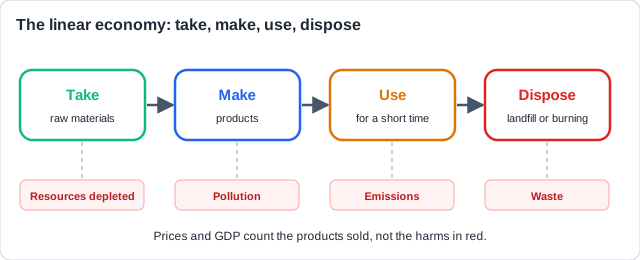
Growth led by supply and demand builds a linear economy, and the harm it does is not counted. The result can be environmental degradation.
The linear economy
- This approach gives a linear economy: take, make, use, dispose.
- Prices and GDP count the products sold.
- They do not usually take into account waste and pollution.
- Nor the issues that cause environmental degradation: depleted resources, lost habitats.
- So rising demand can mean rising harm, with no price paid for it.
Real example: fast fashion grows sales year after year, and the waste is left for someone else to deal with.
Fast fashion in numbers
- Clothing production roughly doubled between 2000 and 2014.
- Less than 1% of the material in clothes is recycled into new clothes.
- About one rubbish truck of textiles is landfilled or burned every second.
- None of this waste is taken off the profits or the GDP that clothing sales add.
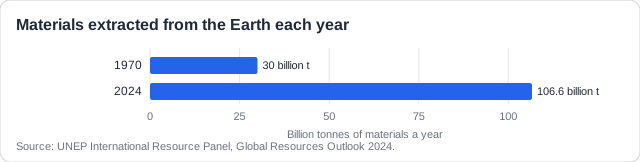
Across the whole world economy, growth driven by demand has meant taking far more from the Earth.
Growth and resource use
- Materials taken from the Earth rose from 30 billion tonnes (1970) to 106.6 (2024).
- Per person: from about 23 kg to 39 kg a day.
- Without change, extraction could rise by about 60% by 2060.
- More extraction means more waste, pollution and habitat loss.
What growth gives
- Jobs and incomes
- Taxes for public services
- Fewer people in extreme poverty
What it usually leaves out
- Waste and pollution
- Resources used up
- Habitats lost
See how examiners mark answers
Answer exam-style questions with model answers. Learn exactly what earns marks and what doesn't.
How this could come up: No paper has asked this statement on its own yet. Likely shapes: Paper 2 Section B (a), outline [4]; a Paper 1 lens question, 'Through the lens of economics, suggest...' [6]; Section A data on resource use [1-3].
Between 2000 and 2014 the number of clothes made in the world roughly doubled, while less than 1% of the material in clothes was recycled into new clothes.
Outline how economic growth driven by supply and demand can lead to environmental degradation.
Model answer plan
See the mark-by-mark plan — for / against / judgement, with marking guidance — in study mode.