Economic growth and GDP at Higher Level: This statement belongs to the HL lens on environmental economics. Governments measure success by economic growth. This page shows how growth and GDP are calculated, and what they fail to show about people and the environment.
Practise this as you read
- Calculate economic growth and GDP per capita.
- Explain why GDP per capita does not show inequality.
- Discuss using GNH or the GPI in place of GDP.
Free preview
This is the free notes preview
You're reading the free notes. Aimnova Pro unlocks the full study experience — and you can try it with your first topic free to keep:
- FlashcardsLock in vocabulary and key terms with spaced repetition.
- Practice questionsAnswer exam-style questions and get instant AI marking.
- Mock exams & past-paper vaultSit full mocks and see exactly how examiners award marks.
- Personalised study planA daily plan built around your exam date and weak areas.
Growth = the yearly change in GDP: GDP is the usual money measure of what a country produces. economic growth is how much it changes, usually as a yearly percentage.
The points to remember
- GDP: the money value of all goods and services a country produces in a period.
- Economic growth: the change in that total value, usually the annual % change in GDP.
- Growth % = (GDP this year minus GDP last year) divided by GDP last year, times 100.
- A negative figure means the economy shrank (a recession).
- Only things with a market value are counted.
Remember it as: GDP is the size of the cake; growth is how fast it grows.
Formula first
Growth (%) = (GDP this year - GDP last year) / GDP last year x 100
Put the numbers in
GDP rises from US$500 billion to US$520 billion: (520 - 500) / 500 x 100
Answer with units
= 4%. The economy grew by 4% that year.
Real example: in 2020, when COVID-19 closed shops and factories, the world economy shrank by about 3%: negative growth.
Know your predicted grade
Take timed mock exams and get detailed feedback on every answer. See exactly where you're losing marks.
Total GDP tells you the size of an economy. To compare how well people live, divide it by the population: GDP per capita.
GDP per capita
- GDP per capita = GDP divided by the population.
- It is a more accurate guide to living standards than total GDP.
- A big country can have a large GDP but a low GDP per capita.
- Compare countries per person, not in total.
India
- Total GDP: about US$3.5 trillion (2023)
- One of the five largest economies
- GDP per capita: about US$2,500
Luxembourg
- Total GDP: far smaller
- Population: under 1 million
- GDP per capita: over US$100,000
Per capita in one line: GDP per capita = GDP / population. US$300 billion / 15 million people = US$20,000 per person.
Per capita GDP is a better guide to living standards, but it is still an average.
What per capita GDP hides
- GDP per capita is an average: it does not show who gets the income.
- A few very rich people can raise the average while most people stay poor.
- So it does not take into account inequalities in how income is shared.
- The Gini index measures how unequally income is shared.
Real example: South Africa: South Africa's GDP per capita is one of the higher ones in Africa, yet its Gini index of about 63 is among the highest in the world. Many people live far below the average income.
Get feedback like a real examiner
Submit your answers and get instant feedback — what you did well, what's missing, and exactly what to write to score full marks.
GDP counts every sale. It does not ask whether the spending made people better off, or what was used up to make it.
What GDP leaves out
- GDP adds all spending, even on coping with harm: clean-ups, hospital bills.
- It does not subtract the loss of natural capital: forests cut, fish stocks used up.
- It ignores pollution, health and wildlife lost.
- It leaves out unpaid work, such as caring for family, and leisure.
- So a country can grow while its people and environment are worse off.
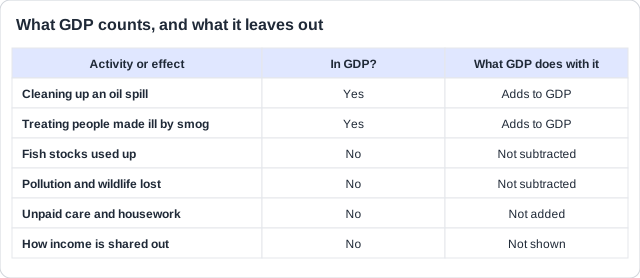
Real example: Deepwater Horizon, 2010: After the oil rig exploded in the Gulf of Mexico, BP's clean-up, fines and compensation came to over US$65 billion. The clean-up work counted towards US GDP; the dead dolphins, turtles and seabirds were never subtracted.
Some places measure progress in other ways: Bhutan's Gross National Happiness and the Genuine Progress Indicator.
Measures beyond GDP
- Gross National Happiness (Bhutan): 9 domains, 33 indicators, incl. ecology and culture.
- Bhutan's 2008 constitution keeps at least 60% of the land under forest for all time.
- Genuine Progress Indicator (GPI): adds unpaid work, subtracts pollution, depletion, inequality.
- World GPI per person peaked in 1978, while GDP per person kept rising.
- Maryland, USA (2010): GPI about US$150 billion v state GDP about US$220 billion.
For using GNH instead of GDP
- Values environment, society and economy equally
- Closer to the Sustainable Development Goals
- Includes ecological diversity
- Less focus on GDP per capita
Against
- Seven of nine domains are social
- Based on personal feelings: hard to measure
- Nine domains are hard to balance in planning
- People still want higher incomes
Learn what examiners really want
See exactly what to write to score full marks. Our AI shows you model answers and the key phrases examiners look for.
How this could come up: The specimen Paper 1 asked students to discuss using Bhutan's GNH Index in place of GDP [6]: arguments for (up to 4 marks), against (up to 4 marks) and a conclusion (1 mark). Data parts may ask you to calculate growth or GDP per capita [1].
In 2010 the state of Maryland, USA, began publishing a Genuine Progress Indicator (GPI). Its first estimate was about US$150 billion, against a state GDP of about US$220 billion.
Discuss the use of the GPI in place of GDP to measure a country's progress.
Model answer plan
See the mark-by-mark plan — for / against / judgement, with marking guidance — in study mode.