Weather, relief and smog at Higher Level: This statement is Higher Level only. It explains why the same traffic gives a clear day in one city and a brown haze in another: sunshine, still air, temperature inversions, and the mountains and buildings that trap the air.
Practise this as you read
- Explain how a temperature inversion traps pollutants.
- Outline why a city in a basin, or a city of high-rise towers, is more prone to smog.
- Read graphs of pollutants through a day or a year, and explain the pattern.
Free preview
This is the free notes preview
You're reading the free notes. Aimnova Pro unlocks the full study experience — and you can try it with your first topic free to keep:
- FlashcardsLock in vocabulary and key terms with spaced repetition.
- Practice questionsAnswer exam-style questions and get instant AI marking.
- Mock exams & past-paper vaultSit full mocks and see exactly how examiners award marks.
- Personalised study planA daily plan built around your exam date and weak areas.
The same traffic, a different day: A city releases much the same NOx and VOCs every day, yet some days are clear and others brown. The difference is the weather: strong insolation, still air and a temperature inversion.
Weather that makes smog worse
- Abundant insolation: strong sunshine drives the reactions that make ozone.
- Sunshine is strongest in summer, near the equator, high up and under high pressure.
- Reduced wind: still air cannot spread pollutants out, so they build up.
- A temperature inversion traps pollutants near the ground.
- Little rain and heat help too: rain washes pollutants out, heat speeds the reactions.
Real example: Los Angeles has some of the sunniest summers of any big city in the USA. A high pressure system sits off the coast for months, bringing cloudless skies, light winds and almost no rain from May to October: every weather factor for smog at once.
Name it and say what it does: 'Low wind' alone is only half an answer. Add its effect: 'low wind, so pollutants are not dispersed and build up over the city'.
Never wonder what to study next
Get a personalized daily plan based on your exam date, progress, and weak areas. We'll tell you exactly what to review each day.
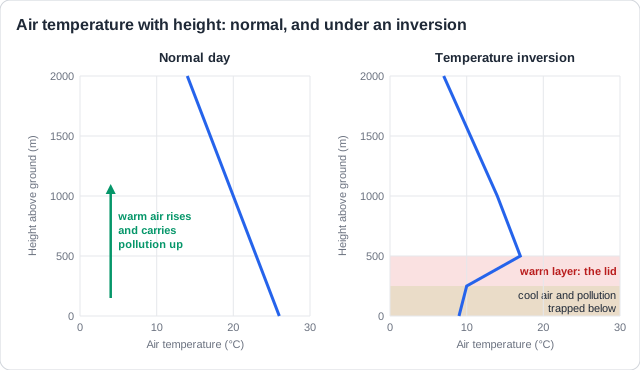
The inversion is the factor papers ask about most. Compare the two graphs: the line bends the other way near the ground.
How an inversion traps smog
- Normally air is warmest near the ground, so it rises and carries pollutants away.
- In an inversion, a layer of warm air sits above cooler air.
- The cool air is denser, so it cannot rise: the warm layer is a lid.
- Pollutants build up under the lid until sun or wind breaks it.
- Inversions form on clear, calm nights, when cold air drains into valleys, and under high pressure.
Clear, calm evening
No clouds act as a blanket, so the ground loses heat fast into space.
Cold air near the ground
The ground cools the air touching it. Cold air is denser and sinks.
Warm air above
The air higher up stays warmer: the inversion.
The lid holds
Morning rush-hour NOx and VOCs cannot rise through it, so they collect and react.
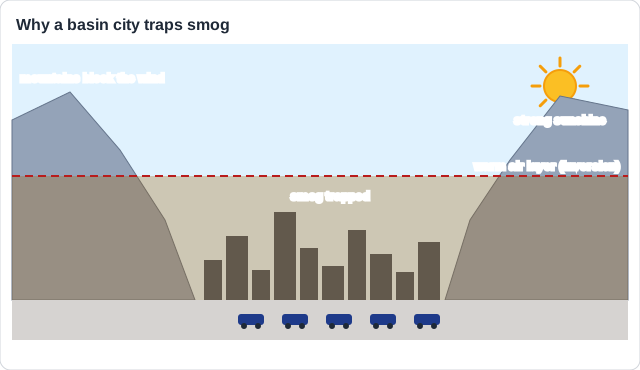
The topography decides whether polluted air can escape. A city in a basin is the worst case.
Relief and city size
- Mountains around a city block the wind and hold cool air in, so inversions last.
- Cities in valleys or basins trap smog: cold air slides down the slopes at night.
- High buildings do the same in a city centre: they restrict air movement.
- A bigger city adds more people, traffic, industry and heating, so more NOx and VOCs.
- Topography and weather work together: mountains plus an inversion plus sun is the worst mix.
| City | Relief | What it adds |
|---|---|---|
| Los Angeles | Basin; San Gabriel Mountains | Cool sea air slides under warm air |
| Mexico City | Basin 2,240 m up, ringed by mountains | Thin air, intense sunlight |
| Santiago, Chile | Between the Andes and Coastal Range | Calm air, many inversions |
| Shanghai | Flat, but dense high-rise towers | Urban canyons, almost 25 million people |
High buildings act like valley walls: each urban canyon slows the wind at street level, so exhaust stays where people breathe.
Stop wasting time on topics you know
Our AI identifies your weak areas and focuses your study time where it matters. No more overstudying easy topics.
The guide asks you to read graphs of pollutants through the day. The same factors explain the patterns through the year.
Reading the patterns
- Ozone peaks in the afternoon, falls as light weakens and wind disperses it, and is lowest just after dawn.
- Wet days have less ozone: clouds block sunlight and rain washes pollutants out.
- Ozone is highest in summer: longer days, stronger sunlight and higher temperatures.
- Monsoon cities such as Delhi peak before the monsoon; clouds and rain bring ozone down.
- More summer travel and tourism add traffic, and so more NOx and VOCs.
- To test a change over time, compare two sets of data with a statistical test such as a t-test.
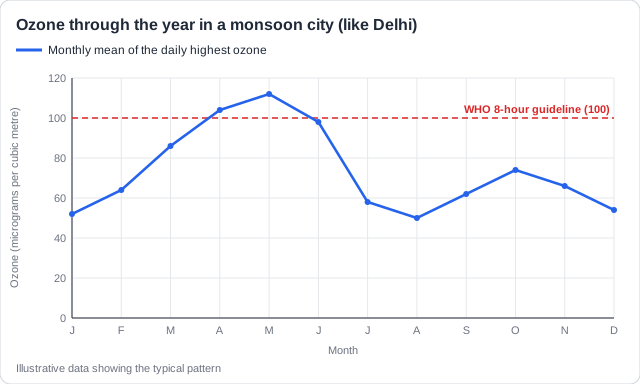
Real example: in Delhi, ozone is worst from April to June, when days are long, skies clear and temperatures pass 40 °C. In July the monsoon brings thick cloud and heavy rain, and ozone falls sharply.
Has the air got cleaner?: Take daily readings from an air-quality database for two years. A t-test shows whether the difference between the two means is significant or just chance.
Explaining a season? Link it to sunlight, heat or traffic: 'people use more air conditioning' is not a reason on its own.
Winter brings a different smog to valley cities, made of smoke and particles. The trap is the same inversion.
Winter smog in valleys
- Winter in a valley: the low sun cannot warm the valley floor, so the air there stays cold.
- Cold, dense, still air sits under warmer air: inversions are more frequent in winter.
- People burn more fuel for heat, so more smoke and particles are released.
- Less rain in many winters means fewer pollutants are washed out.
- This winter smog is mostly particles (smoke, soot), not ozone: but the trap is the same.
London, December 1952
- Cold, still air under high pressure and an inversion
- Coal smoke and sulfur dioxide from homes and power stations
- About 4,000 deaths in days; later estimates up to 12,000
- Led to the Clean Air Act of 1956
Photochemical smog
- Sunny, warm, still days, often summer
- NOx and VOCs from traffic, turned into ozone and PANs
- Peaks in the afternoon, a few hours after the rush hour
- Los Angeles, Mexico City, Santiago in summer
Real example: Ulaanbaatar, in Mongolia, lies in a river valley between mountains. Winter nights fall below -30 °C, and families in the ger districts burned raw coal for heat. Under still, cold air its winter smog was among the worst in the world, until raw coal was banned in 2019.
Remember it as: Sun, still air, a lid and walls: the four smog makers.
See how examiners mark answers
Answer exam-style questions with model answers. Learn exactly what earns marks and what doesn't.
How this comes up: Data questions: read the lowest or highest ozone on a graph [1], explain the pattern [2-3], give a human and a natural factor [1 each], or say why one city is more prone than another [2]. Essay part (a): outline two factors and what each does [4].
Santiago, the capital of Chile, lies in a basin between the Andes and a lower coastal range of mountains.
Outline two local conditions that may increase the severity of photochemical smog.
Model answer plan
See the mark-by-mark plan — for / against / judgement, with marking guidance — in study mode.
In the [4] shape, each factor earns two marks: one for naming it, one for what it does.
Mexico City often has photochemical smog, while many smaller towns nearby rarely do.
Outline two factors that affect the frequency and severity of photochemical smog in an area.
Model answer plan
See the mark-by-mark plan — for / against / judgement, with marking guidance — in study mode.