Measuring population change at Higher Level: The same five measures as SL, through different real cases: China's first natural decrease in 60 years, Pakistan's 27-year doubling time and a world close to replacement-level fertility.
Practise this as you read
- Calculate a natural increase rate and a doubling time, converting per 1000 to % first.
- Compare two measures with similarities and differences.
Free preview
This is the free notes preview
You're reading the free notes. Aimnova Pro unlocks the full study experience — and you can try it with your first topic free to keep:
- FlashcardsLock in vocabulary and key terms with spaced repetition.
- Practice questionsAnswer exam-style questions and get instant AI marking.
- Mock exams & past-paper vaultSit full mocks and see exactly how examiners award marks.
- Personalised study planA daily plan built around your exam date and weak areas.
Births minus deaths: The natural increase rate shows how fast a population grows from births and deaths alone. It uses the crude birth rate and the crude death rate.
The points to remember
- Natural increase = births − deaths: it leaves out migration.
- As a rate: NIR = CBR − CDR, given per 1000 people.
- As a percentage: NIR (%) = (CBR − CDR) ÷ 10.
- From totals: (births − deaths) ÷ population × 100 gives the same %.
- NIR can be negative: a natural decrease, when deaths outnumber births.
- Always write the unit: % or per 1000. A bare '0.8' is not an answer.
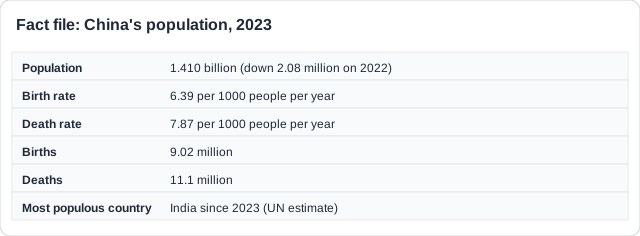
Worked example: two ways to the same answer: From the rates: NIR = (CBR − CDR) ÷ 10 = (6.39 − 7.87) ÷ 10 = −0.148% (or −1.48 per 1000).
From the totals: (9.02 − 11.1) million ÷ 1,410 million × 100 = about −0.15%.
Real example: China's NIR turned negative in 2022 for the first time in 60 years, and in 2023 India overtook it as the most populous country.
Remember it as: Births minus deaths, divide by ten, add the % sign.
Study smarter, not longer
Most students waste 40% of study time on topics they already know. Our AI tracks your progress and optimizes every minute.
A growth rate of 2% sounds small, but it doubles a population quickly. The doubling time turns a percentage into years, using the rule of 70.
Doubling time
- Doubling time = the number of years a population takes to double at its current growth rate.
- Rule of 70: doubling time = 70 ÷ growth rate (%).
- Use the growth rate as a %: if the NIR is given per 1000, divide by 10 first.
- If only birth and death rates are given, work out the NIR first: (CBR − CDR) ÷ 10.
- Faster growth = shorter doubling time. A shrinking population never doubles.
- Give the unit: years.
Worked example: Pakistan's 2023 census found growth of 2.55% a year.
DT = 70 ÷ 2.55 = 27.5 years.
When the NIR is per 1000: an NIR of 21.24 per 1000 = 2.124%, so DT = 70 ÷ 2.124 = 33 years. Dividing 70 by 21.24 (3.3 years) is the classic slip.
| Growth rate | Doubling time |
|---|---|
| 0.5% | 140 years |
| 1% | 70 years |
| 2% | 35 years |
| 3.5% | 20 years |
Real example: the world grows by a little under 1% a year, so even the global population would take over 70 years to double at today's rate.
It is only an estimate: The rule of 70 assumes the growth rate stays the same. Births, deaths and migration change, so a doubling time is a forecast, not a fact.
The crude birth rate counts births for everyone, even men and grandparents. The total fertility rate counts children per woman, so it shows the future better.
Total fertility rate
- Total fertility rate (TFR) = the average number of children a woman would have in her lifetime.
- It counts births per woman of childbearing age, unlike the crude birth rate (per 1000 people).
- Replacement level is about 2.1: two children replace the parents, plus a little for children who die young.
- TFR below 2.1 for many years: in time the population falls and ages, unless immigrants arrive.
- TFR above 2.1: the population keeps growing.
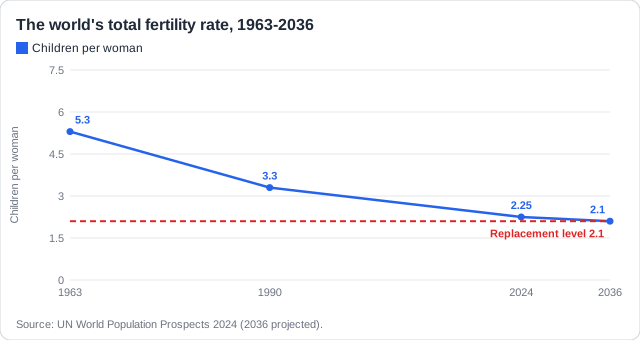
Real example: the world's TFR is 2.25 (2024), one child fewer than in 1990. Over half of all countries are below 2.1; Italy is at 1.18 (2024).
Per woman, not per 1000: TFR is about families, not the whole population: 'children per woman'. Size of the population does not come into it.
Practice with exam-style questions
Answer exam-style questions and get AI feedback that shows you exactly what examiners want to see in a full-marks response.
Life expectancy sums up how healthy and safe a place is.
Life expectancy
- Life expectancy = the average number of years a person can expect to live, usually from birth.
- It assumes today's death rates stay the same for the rest of their life.
- Higher with good healthcare, a healthy diet and enough income to afford it.
- Higher with clean water and sanitation, and less air pollution.
- Lower after wars, famines and pandemics.
Healthcare
- 2021: COVID-19 overwhelmed hospitals and world life expectancy fell to 70.9.
Diet and income
- Richer families afford better food, and fewer children are underfed.
Clean water and air
- Cities that move factories out and clean their air cut lung and heart disease.
Real example: the world's life expectancy fell to 70.9 years in 2021 during COVID-19, then rose to 73.3 by 2024.
Give the reason, not a label: 'Better quality of life' alone is not enough. Say what is better: healthcare, diet, clean water, less pollution.
Papers ask for the similarities and differences between two measures. Learn what each one counts.
Comparing the measures
- All four measures are averages (mean values), usually for one year.
- CBR: births per 1000 of the whole population; a snapshot of one year.
- TFR: births per woman, over her lifetime; it allows for the age of the women.
- NIR: births and deaths; it can be negative; it shows growth better than CBR alone.
- DT: an estimate from the growth rate; it takes deaths into account, CBR does not.
- Together they let us compare populations and predict change.
| Measure | Counts | Unit | Can be negative? |
|---|---|---|---|
| Crude birth rate | Births in the whole population | Per 1000 per year | No |
| Total fertility rate | Children per woman, lifetime | Children per woman | No |
| Natural increase rate | Births minus deaths | % or per 1000 | Yes |
| Doubling time | Years to double | Years | No (none if shrinking) |
| Life expectancy | Average years lived | Years | No |
Real example: China, 2023: CBR 6.39 per 1000, NIR −0.148%, no doubling time: a population that has begun to shrink.
How a [4] is marked: One mark per point: a definition, a similarity, a difference. Give both sides: only similarities or only differences caps the answer at [3].
Feeling unprepared for exams?
Get a clear study plan, practice with real questions, and know exactly where you stand before exam day. No more guessing.
Papers also hand you a graph, a map or a table of population data. Read it the same way every time.
How to read population data
- Describe the trend: rising, falling or steady, and when it changes.
- Give the rate of change: slow, rapid, exponential, slowing down.
- Quote numbers and years from the graph.
- A fall in the line = negative growth that year.
- Compare places or regions: which is highest, which is lowest.
- Population density = population ÷ area (people per km²).
Rise
Japan grew fast after 1945, to about 128 million.
Peak
It peaked around 2008: births fell, people lived longer.
Fall
Deaths now outnumber births by about 900,000 a year.
Compare
Nigeria, India: still rising. China: falling since 2022.
Trend, rate, differences: When describing population data, state the trend (rising or falling), the rate of change, and any differences between places, with numbers.
Real example: a map of population density uses people per km²: Bangladesh has about 1,300 people per km², Australia about 3.
How this comes up: Calculate a natural increase rate or a doubling time from a fact file or table [1]; a crude death rate [1]; what a fertility rate means for the future [1]; why life expectancy is higher [1]; describe trends [2]; compare two measures, or outline demographic tools [4].
In 2024 Italy recorded about 6.3 births per 1000 people and a total fertility rate of 1.18.
Outline the similarities and differences between crude birth rate and total fertility rate.
Model answer plan
See the mark-by-mark plan — for / against / judgement, with marking guidance — in study mode.