Global population projections at Higher Level: The same growth curve and UN scenarios as SL, through different real cases: the 63 countries already past their peak, and a rival model from IHME that sees the world peak 20 years sooner.
Practise this as you read
- Read a projection graph: the median and the range.
- Weigh how far each model can predict growth.
Free preview
This is the free notes preview
You're reading the free notes. Aimnova Pro unlocks the full study experience — and you can try it with your first topic free to keep:
- FlashcardsLock in vocabulary and key terms with spaced repetition.
- Practice questionsAnswer exam-style questions and get instant AI marking.
- Mock exams & past-paper vaultSit full mocks and see exactly how examiners award marks.
- Personalised study planA daily plan built around your exam date and weak areas.
Slow, then very fast: For most of history the human population grew slowly. Since about 1800 it has shot up in a rapid growth curve.
The points to remember
- The world's population has followed a rapid growth curve: slow for thousands of years, then very fast.
- About 1 billion in 1800, 2.5 billion in 1950, 8.2 billion in 2024.
- Each extra billion came faster: 123 years from 1 to 2 billion, about 12 years for each recent one.
- The growth rate peaked at about 2% a year in the 1960s; it is now below 1%.
- But the base is so large that about 70 million people are still added every year.
- About 60% of people live in Asia; growth is fastest in sub-Saharan Africa.
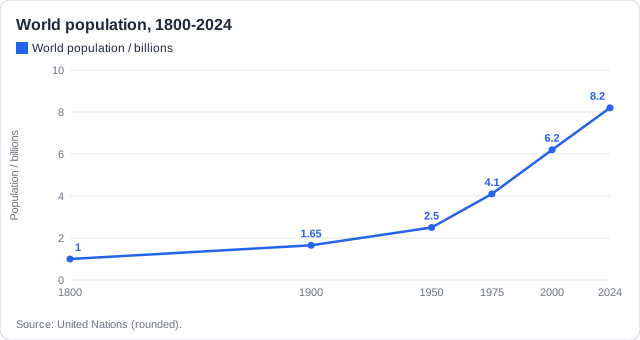
Remember it as: Slow for ages, then the J: from 1 billion to 8 in about 220 years.
Real example: the world reached 8 billion on 15 November 2022, only about 11 years after it passed 7 billion.
Get feedback like a real examiner
Submit your answers and get instant feedback — what you did well, what's missing, and exactly what to write to score full marks.
Nobody can count the future, so the UN uses projection models.
The UN's three scenarios
- The UN uses projection models to predict the world's future population.
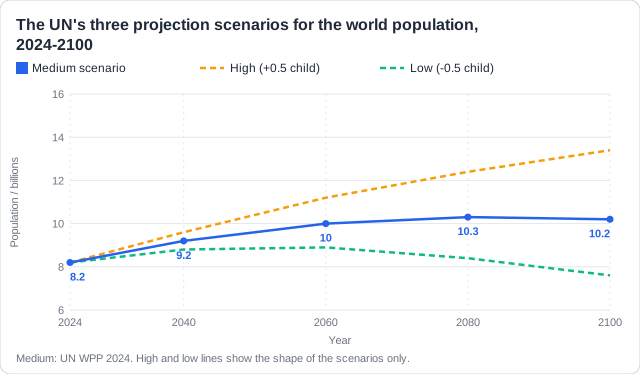
- They give three scenarios: low, medium and high.
- The scenarios differ in their future fertility rates: about half a child per woman less or more than the medium.
- Medium (2024): a peak of about 10.3 billion in the mid-2080s, then 10.2 billion in 2100.
- The lines stay close until about 2050, then spread apart.
| Scenario | Fertility it assumes | World population |
|---|---|---|
| High | About 0.5 child per woman above medium | Keeps rising past 2100 |
| Medium | The UN's best guess | Peak about 10.3 billion, mid-2080s |
| Low | About 0.5 child per woman below medium | Peaks sooner, then falls |
Real example: 63 countries, including China, Japan, Germany and Russia, have already passed their peak, and the UN now gives an 80% chance that the world population peaks this century (about 30% a decade ago).
The scenarios spread apart because the future is uncertain. A reason for the uncertainty must be specific: 'predicting is hard' is not a reason.
Why projections are uncertain
- Future fertility is the biggest unknown: it is why there are three scenarios.
- Different models use different figures and get different answers.
- Governments may change their population policies, raising or lowering births.
- Disasters, disease and war cannot be predicted.
- Migration does not change the world total: people only move between countries.
Fertility
- Fertility in China fell much faster than the UN expected, lowering every projection.
Policy
- Hungary now pays families to have more children: a policy can push births up.
Shocks
- Wars, famines and pandemics change death rates suddenly.
Real example: IHME (The Lancet, 2020) used a different model and projected a peak of 9.7 billion in 2064, falling to 8.8 billion by 2100: lower and sooner than the UN.
Not migration, for the world: For a country, migration is a big unknown. For the whole world it changes nothing: migrants only move from one country to another.
Learn what examiners really want
See exactly what to write to score full marks. Our AI shows you model answers and the key phrases examiners look for.
Each concept and model helps predict growth, but each has a weakness. A [9] weighs them up. Two models met later in this topic also count: the age-sex pyramid and the demographic transition model.
How well can models predict?
- Rates (birth, death, natural increase): exact for today, but they change every year.
- Doubling time assumes the growth rate stays the same, which it rarely does.
- Fertility rate: the best single guide to the future, but nobody knows how it will change.
- Age-sex pyramids show how many future parents there are: good for the next 20-30 years.
- The DTM shows the usual path as countries develop, but not when each stage comes.
- UN scenarios give a range, not one number, and are revised every few years.
They help because
- Today's rates and structure are measured accurately
- Many young women today = many births soon
- The UN range shows how sure we can be
They are limited because
- Fertility, policies and shocks change
- Models assume rates stay the same
- Different models give different answers
Real example: Japan's shrinking population was predicted from its pyramid decades ahead; South Korea's very fast fall in fertility was not.
The conclusion: A fair judgement: the models predict the next 20-30 years well, because the parents are already born, but the long-term future still depends on fertility, which nobody knows.
How this comes up: Read a year or a value from a projection graph [1]; one reason why projections are uncertain [1]; outline the UN scenarios [4]; to what extent models can predict population growth [9].
In 2024 the UN projected that the world population will peak at about 10.3 billion in the mid-2080s.
Outline how UN projection models are used to predict the future global human population.
Model answer plan
See the mark-by-mark plan — for / against / judgement, with marking guidance — in study mode.