Two countries on the DTM at Higher Level: This statement is Higher Level only. It follows two real countries at different stages of the demographic transition model, Nigeria and South Korea, from the past, through today, into the future, and explains why they differ.
Practise this as you read
- Describe each country's population trends with data from three points in time.
- Explain the historical, cultural, religious, economic, social and political reasons.
- Test a hypothesis about income and fertility with secondary data.
Free preview
This is the free notes preview
You're reading the free notes. Aimnova Pro unlocks the full study experience — and you can try it with your first topic free to keep:
- FlashcardsLock in vocabulary and key terms with spaced repetition.
- Practice questionsAnswer exam-style questions and get instant AI marking.
- Mock exams & past-paper vaultSit full mocks and see exactly how examiners award marks.
- Personalised study planA daily plan built around your exam date and weak areas.
Two countries, one model: The DTM is easiest to understand through two real countries at different stages, followed from the past, through today, into the future.
The points to remember
- Pick two countries at different DTM stages.
- Describe the past (at least 30 years ago), the present and the future (at least 30 years ahead).
- Use patterns and trends: birth and death rates, fertility, life expectancy, pyramids.
- Give reasons: historical, cultural, religious, economic, social and political.
- Use real numbers with their years.
| Nigeria 1990 | Nigeria 2024 | Nigeria 2054 | South Korea 1990 | South Korea 2024 | South Korea 2054 | |
|---|---|---|---|---|---|---|
| Population (millions) | 97 | 233 | 376 | 44 | 52 | 43 |
| Birth rate (per 1000) | 44.5 | 32.5 | 21.3 | 15.5 | 4.7 | 4.2 |
| Death rate (per 1000) | 18.9 | 11.6 | 10.5 | 5.7 | 6.9 | 16.7 |
| Fertility rate | 6.5 | 4.4 | 2.5 | 1.6 | 0.73 | 1.1 |
| Life expectancy (years) | 46 | 55 | 59 | 71 | 84 | 88 |
| Aged 65 and over (%) | 3.1 | 3.0 | 4.8 | 4.9 | 19.3 | 40.9 |
2054 figures are UN projections. Watch the fertility rate and the median age: Nigeria's is 18 years, South Korea's 45.
Stop wasting time on topics you know
Our AI identifies your weak areas and focuses your study time where it matters. No more overstudying easy topics.
Nigeria is Africa's most populous country, and one of the fastest-growing large countries in the world.
Nigeria: past, present, future
- Past: 97 million people in 1990; fertility 6.5; 45% under 15.
- Present: 233 million in 2024; fertility 4.4; death rate down to 11.6 per 1000.
- Future: about 376 million by 2054, with fertility near 2.5.
- Pyramid: a wide base narrowing slowly as fertility falls.
- Stage: late stage 2 moving into stage 3: deaths fell first, births are falling slowly.
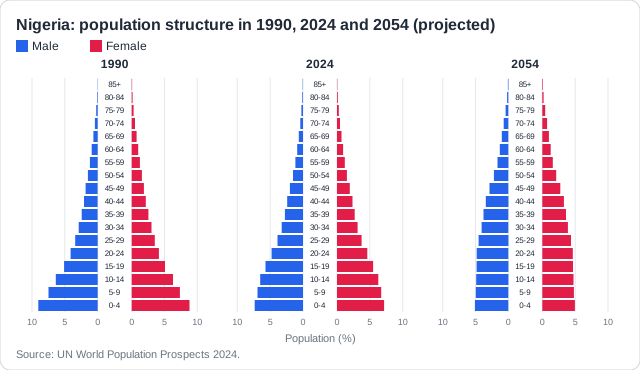
Why are Nigerian families still large? The guide asks for reasons of six kinds.
Reasons in Nigeria
- Economic: children help on farms and support parents in old age.
- Cultural: large families bring status; early marriage; polygamy in some areas.
- Religious: some leaders discourage contraception; fertility is highest in the north.
- Social: many girls leave school early; only about 12% of married women used modern contraception (2018).
- Political: policies since 1988 aimed at fewer children but were weakly carried out.
- Historical: deaths fell after independence (1960) with vaccines and clean water.
Farm
- Children fetch water and help in the fields, so they add to the family's income
Marriage
- Girls often marry in their teens; polygamy is common in some areas, so more children are born to one household
School
- Many girls leave school early, so they have fewer chances of paid work outside the home
Old age
- There are few pensions, so parents rely on their children to look after them
See how examiners mark answers
Answer exam-style questions with model answers. Learn exactly what earns marks and what doesn't.
South Korea went from a poor farming country to a rich industrial one in a single lifetime, and its population changed just as fast.
South Korea: past, present, future
- Past: 36 million in 1975; fertility 3.3, falling to 1.6 by 1990.
- Present: 52 million in 2024; fertility 0.73, the lowest in the world.
- Future: about 43 million by 2054; 41% aged 65 and over.
- Pyramid: from a wide base (1990) to an inverted shape (2054).
- Stage: stage 4 moving into stage 5: deaths now exceed births.
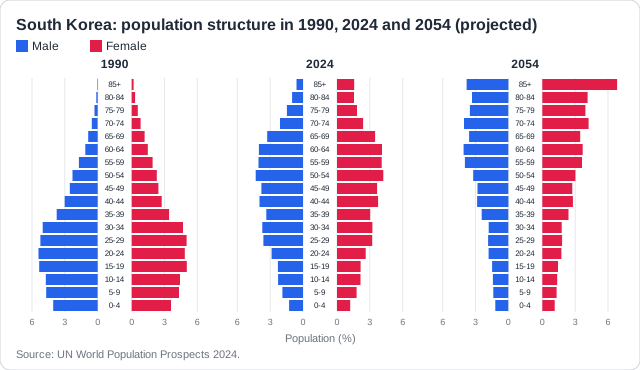
The same six kinds of reason explain South Korea's opposite path.
Reasons in South Korea
- Political: a national family planning programme from 1962: 'stop at two'.
- Economic: rapid industrialisation and urbanisation from the 1960s.
- Social: women's education and careers; housing and private tutoring are costly.
- Cultural: long working hours; most births within marriage, and fewer people marry.
- Political now: pro-natalist support since 2006 has not reversed the fall.
1962
An anti-natalist family planning programme begins, as part of the first economic plan.
1970s
Posters: 'Stop at two, regardless of sex'. Factories and cities grow fast.
1984
Fertility falls below replacement level, 2.1.
2006
The government turns pro-natalist: child payments and parental leave.
2023
Fertility reaches 0.72, the world's lowest; costly housing and hagwon are often blamed.
Study smarter, not longer
Most students waste 40% of study time on topics they already know. Our AI tracks your progress and optimizes every minute.
Put the two countries on one graph and the model appears: the same path, at very different speeds.
Side by side on the DTM
- Both countries show the same model, at different speeds.
- South Korea moved from stage 2 to stage 4 in about 40 years.
- Nigeria's birth rate is falling slowly: momentum keeps it growing to 2074 and beyond.
- South Korea's population has peaked and is set to shrink.
- The DTM did not predict a stage-5 fall as deep as South Korea's.
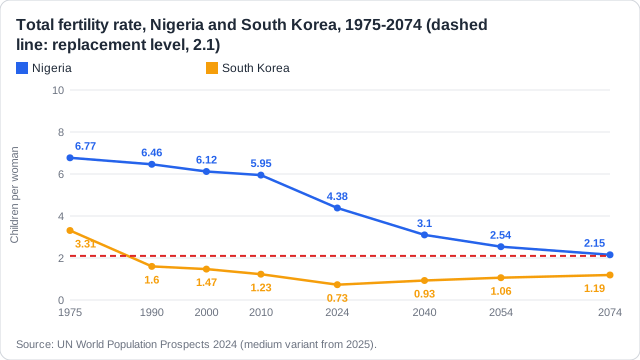
Nigeria: growth ahead
- Population 63 million (1975) to 233 million (2024)
- Projected 444 million by 2074, still growing
- Huge needs for food, schools and jobs
South Korea: decline ahead
- Population 36 million (1975) to 52 million (2024)
- Projected 32 million by 2074
- Fewer workers, more pensions and care
You can test a link between a country's wealth and its fertility yourself. Start with a hypothesis.
Testing a hypothesis with secondary data
- Write a hypothesis: a statement to test, such as 'fertility falls as income rises'.
- Collect secondary data from Gapminder, the World Bank or Our World in Data.
- Plot a scatter graph: the indicator on one axis, the demographic factor on the other.
- Use a suitable statistical tool: Spearman's rank tests the strength of the relationship.
- Online calculators, such as the Social Science Statistics calculator, do the sums.
- A correlation is not proof of cause.
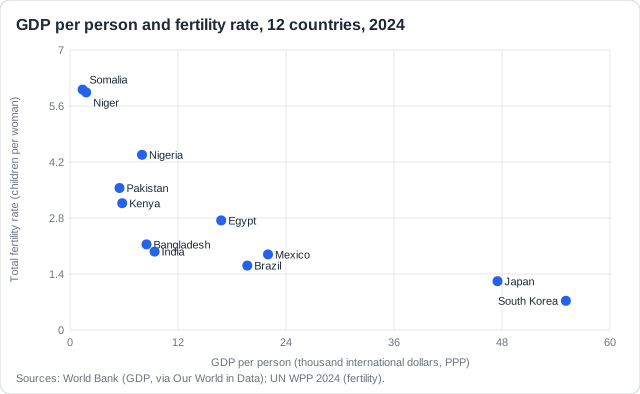
Real example: hypothesis: 'the higher a country's GDP per person, the lower its fertility rate'. For these 12 countries, Spearman's rank gives -0.95, a strong negative relationship, so the hypothesis is supported. Nigeria sits above the trend: richer than Kenya, yet more children per woman, because of the cultural and social reasons above.
Practice with exam-style questions
Answer exam-style questions and get AI feedback that shows you exactly what examiners want to see in a full-marks response.
How this comes up: Paper 2 Section B: explain the reasons for population trends in two named countries [7], or evaluate the DTM with them [9]. Paper 1: compare two countries' data in a table or pyramids.
Countries pass through the stages of the demographic transition model at very different times and speeds.
Using two named countries at different stages of the demographic transition model, explain the reasons for the differences in their population growth.
Model answer plan
See the mark-by-mark plan — for / against / judgement, with marking guidance — in study mode.