Dependency ratio and momentum at Higher Level: This statement is Higher Level only. It uses age-sex pyramids to work out how many dependents each worker supports, and to explain why a young population keeps growing long after families have become smaller.
Practise this as you read
- Calculate a dependency ratio from a pyramid, formula first.
- Outline issues for a country's future economy from its pyramid.
- Explain the role of population momentum in population growth.
Free preview
This is the free notes preview
You're reading the free notes. Aimnova Pro unlocks the full study experience — and you can try it with your first topic free to keep:
- FlashcardsLock in vocabulary and key terms with spaced repetition.
- Practice questionsAnswer exam-style questions and get instant AI marking.
- Mock exams & past-paper vaultSit full mocks and see exactly how examiners award marks.
- Personalised study planA daily plan built around your exam date and weak areas.
Who supports whom?: Children and old people are dependents: most of them are looked after by people who are economically productive. The dependency ratio compares the two groups.
The points to remember
- Dependents: under 15 and 65 and over; economically productive: 15 to 64.
- Dependency ratio = (aged 0-14 + aged 65+) ÷ aged 15-64 × 100.
- It tells you how many dependents there are for every 100 people of working age.
- Use numbers or percentages from the pyramid: the ratio comes out the same.
- It can be split: young dependency (0-14) and old dependency (65+).
Formula
Dependency ratio = (aged 0-14 + aged 65+) ÷ aged 15-64 × 100.
Read the pyramid
Japan, 2024: aged 0-14 = 11.4%, aged 65+ = 29.8%, so aged 15-64 = 100 - 11.4 - 29.8 = 58.8%.
Add the dependents
11.4 + 29.8 = 41.2%.
Divide and multiply
41.2 ÷ 58.8 × 100 = 70.1.
Say what it means
About 70 dependents for every 100 people of working age.
Two common slips: Divide by the working-age group, not by the whole population. And no unit: the answer is a number of dependents per 100 workers, not a percentage of the population.
Stop wasting time on topics you know
Our AI identifies your weak areas and focuses your study time where it matters. No more overstudying easy topics.
The guide makes a surprising point: the ratio is high at both ends of the demographic story, but for opposite reasons.
When is the ratio high?
- The ratio is high when fertility is very high: many children (Niger).
- It is also high when fertility is very low: many old people (Japan).
- It is lowest in between, when a big group of adults has few children and few elderly parents.
- Read it from the shape: a wide base, or a wide top, means many dependents.
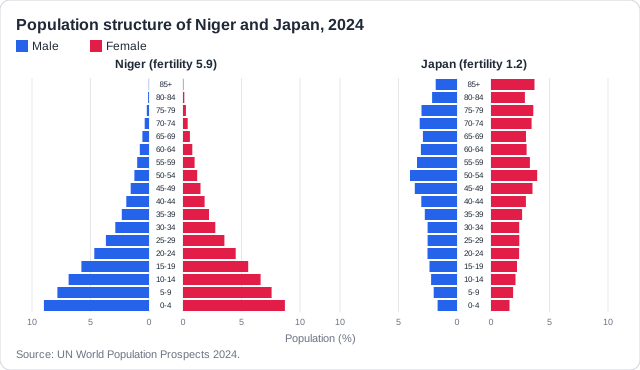
| Country, 2024 | Aged 0-14 | Aged 65+ | Dependency ratio |
|---|---|---|---|
| Niger (fertility 5.9) | 46.6% | 2.6% | (46.6 + 2.6) ÷ 50.8 × 100 = 96.8 |
| Japan (fertility 1.2) | 11.4% | 29.8% | 70.1 |
| India (fertility 1.96) | 24.6% | 7.1% | 46.6 |
| World | 24.7% | 10.2% | 53.7 |
India sits in the low middle: fertility has fallen, but its large group of adults still has few old parents. Economists call this window a demographic dividend.
A paper may give you a pyramid and ask what it means for a country's future economy. Japan shows every point.
What a changing ratio means
- Falling births mean a smaller future workforce.
- A proportionally smaller workforce limits economic growth (GDP).
- Fewer workers must support more old people: a rising dependency ratio.
- More money is needed for pensions and health care.
- More resources are needed for the care and independent living of old people.
- A very young population needs schools now and jobs later.
Fewer births
- Japan's fertility rate has been below 1.5 since the mid-1990s: 1.2 in 2024
Fewer workers
- The population fell from 128 million in 2010 to 124 million in 2024, and the working-age share is shrinking
More elderly
- Almost 30% are 65 or over; pensions and health care cost more each year
Responses
- Raising the retirement age, more care robots, and letting in more foreign workers
The other end: In Niger the problem is the reverse: nearly half the people are children, so the country must pay for schools and health care now and create millions of jobs later.
See how examiners mark answers
Answer exam-style questions with model answers. Learn exactly what earns marks and what doesn't.
Why growth does not stop at once: When the fertility rate falls to replacement level, you might expect growth to stop. It does not: the number of women of reproductive age matters too.
Population momentum
- Population momentum: a population keeps growing even after the fertility rate falls.
- Growth depends on children per woman and on the number of women of reproductive age.
- A young structure (wide base) means many women will soon reach reproductive age.
- Even at replacement level, their many children keep births above deaths for decades.
- Growth slows only when the big young groups have grown old.
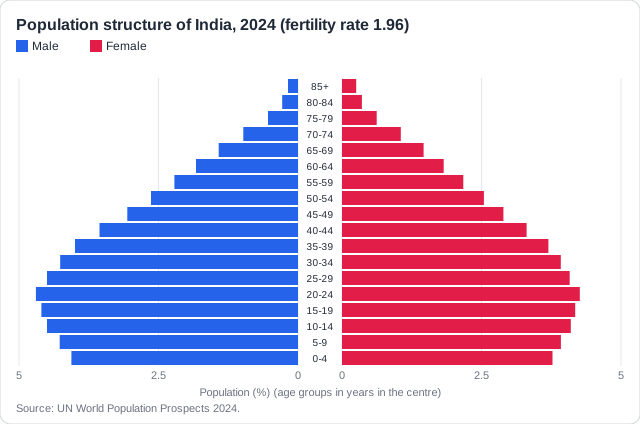
Real example: India's fertility rate was 1.96 in 2024, below replacement. But the young age groups born when fertility was 3 or 4 are now entering their twenties, so births still outnumber deaths.
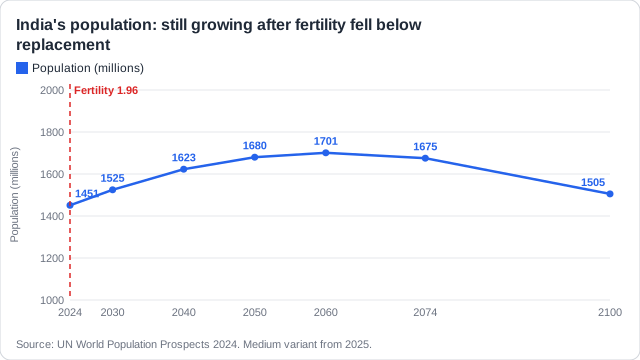
Read the shape: Look for bars at ages 10-29 that are wider than the 0-4 bar: fertility has fallen, but the parents of the next twenty years are already born.
The same idea explains the world's future, and why some countries shrink.
Momentum both ways
- Momentum works in both directions.
- A population with few young women keeps shrinking even if fertility rises.
- Small young groups mean few future mothers, so births stay low for decades.
- Japan and South Korea face this negative momentum now.
Positive momentum: the world
- The UN tried a 'momentum' scenario: fertility at replacement from 2024
- Even so, the world grows from 8.2 to 9.6 billion by 2100
- The extra people come from today's large young groups
Negative momentum: Japan
- Few women are now in their twenties and thirties
- Even if fertility rose, births would stay low for decades
- The UN projects 124 million (2024) falling to 102 million by 2054
Remember it as: Count the mothers, not just the babies per mother.
Study smarter, not longer
Most students waste 40% of study time on topics they already know. Our AI tracks your progress and optimizes every minute.
How this comes up: Paper 1: from a pyramid, outline issues for a country's future economic development [2]. Paper 2: explain the role of population momentum beside a pyramid [3], or calculate a dependency ratio.
Spain's age-sex pyramid for 2024 has a narrow base and is widest at ages 45-59. Its fertility rate is 1.2 children per woman, and 21% of its people are aged 65 or over.
Outline potential issues for the future economic development of Spain.
Model answer plan
See the mark-by-mark plan — for / against / judgement, with marking guidance — in study mode.
The second shape asks you to explain momentum. Use the same three steps every time: define, link to the structure, then show the result.
The Philippines' fertility rate fell to 1.9 children per woman in 2024, below replacement level, but 28% of its people are under 15.
Explain the role that population momentum plays in population growth.
Model answer plan
See the mark-by-mark plan — for / against / judgement, with marking guidance — in study mode.