IPCC emissions scenarios at Higher Level: This statement is Higher Level only. It covers the IPCC's five emissions scenarios, why there are five, the targets for 1.5°C and 2°C, and how to read the scenario graphs for their implications.
Practise this as you read
- Explain why the IPCC uses several scenarios instead of one forecast.
- Interpret a graph of the scenarios and its implications for the Paris targets.
Free preview
This is the free notes preview
You're reading the free notes. Aimnova Pro unlocks the full study experience — and you can try it with your first topic free to keep:
- FlashcardsLock in vocabulary and key terms with spaced repetition.
- Practice questionsAnswer exam-style questions and get instant AI marking.
- Mock exams & past-paper vaultSit full mocks and see exactly how examiners award marks.
- Personalised study planA daily plan built around your exam date and weak areas.
Five futures, not one forecast: The IPCC cannot know what the world will choose, so it does not make one forecast. It draws five scenarios, each an SSP, and works out the warming each one leads to.
Why there are five scenarios
- Nobody knows exactly how much greenhouse gas the world will release: that depends on choices.
- Population, economic growth, technology and government policy could all go different ways.
- So the IPCC models five scenarios, not one forecast: from very low to very high emissions.
- Each scenario shows the consequences of one path, so decision-makers can compare the risks.
- A scenario is not a prediction: it answers 'what if?'
| What is uncertain | Real example of the uncertainty |
|---|---|
| Policy | The USA joined Paris in 2016, left in 2020, rejoined in 2021 and left again in 2026 |
| Technology | Electricity from big solar farms became about 85% cheaper between 2010 and 2020 |
| Population and wealth | As its economy grew, India's CO2 emissions rose by over 40% between 2015 and 2024 |
Remember it as: A scenario answers 'what if?', not 'what will?'
See how examiners mark answers
Answer exam-style questions with model answers. Learn exactly what earns marks and what doesn't.
Each name has two parts. 'SSP1' to 'SSP5' is the story of the world; the second number is the radiative forcing by 2100. A bigger number means more heat trapped.
The five scenarios
- SSP1-1.9 very low: CO2 reaches net zero around 2050; about 1.4°C by 2081-2100.
- SSP1-2.6 low: net zero after 2050; about 1.8°C.
- SSP2-4.5 middle: emissions stay near today's level to 2050; about 2.7°C.
- SSP3-7.0 high: emissions roughly double by 2100; about 3.6°C.
- SSP5-8.5 very high: emissions roughly double by 2050; about 4.4°C.
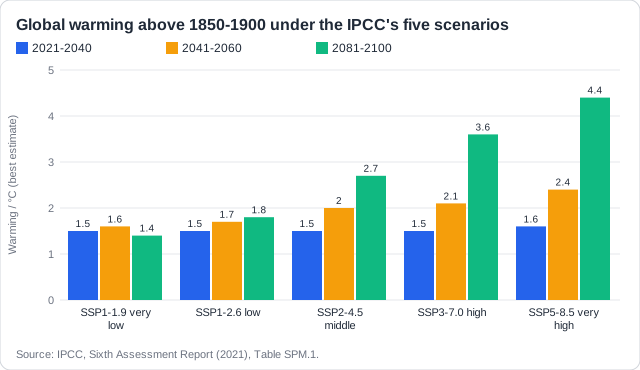
How to read the graph: Compare the first bars: about 1.5°C in every scenario, because the next twenty years of warming is already locked in. Then compare the last bars: the choices made now decide the 2100 result.
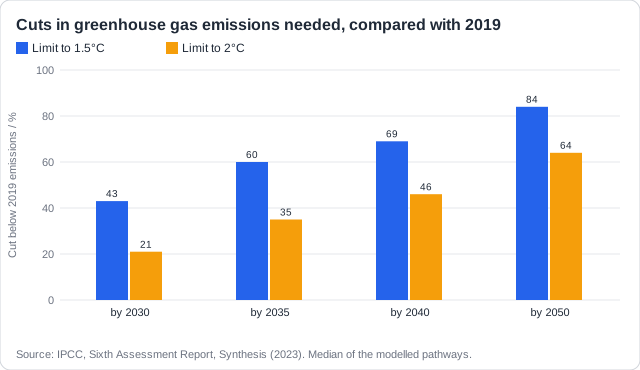
The scenarios turn the Paris targets into numbers. To stay at 1.5°C above pre-industrial levels, with little or no overshoot, emissions must fall fast this decade and reach net zero.
The targets
- The Paris targets: well below 2°C, aiming for 1.5°C, above pre-industrial.
- For 1.5°C: cut greenhouse gases 43% by 2030 and 60% by 2035 (from 2019).
- CO2 must reach net zero in the early 2050s: 'net zero by about 2050'.
- For 2°C: cut 21% by 2030; CO2 net zero in the early 2070s.
- Every year of delay makes the later cuts steeper.
Real example: 2024 was the first calendar year above 1.5°C, at about 1.55°C (WMO). That does not yet break the Paris limit, which is an average over about twenty years, but it shows how close the world already is.
Study smarter, not longer
Most students waste 40% of study time on topics they already know. Our AI tracks your progress and optimizes every minute.
The skill here is reading the scenarios for their implications: what each path means for people, and which one the world is on now.
What the scenarios imply
- Higher scenarios mean more sea level rise: up to about 1 m by 2100 under SSP5-8.5.
- They also mean more heatwaves, droughts and heavy rain, and higher risk of tipping points.
- Even the lowest scenario reaches about 1.5°C in the next twenty years.
- Today's pledges point to about 2.3-2.5°C: between the low and middle scenarios.
- The gap between pledges and the 1.5°C path is the emissions gap.
| Scenario | Warming 2081-2100 | Sea level rise by 2100 |
|---|---|---|
| SSP1-1.9 | 1.4°C | 0.28-0.55 m |
| SSP2-4.5 | 2.7°C | 0.44-0.76 m |
| SSP5-8.5 | 4.4°C | 0.63-1.01 m |
Real example: the UN's Emissions Gap Report of November 2025 found that, if every country keeps its pledges, warming reaches about 2.3-2.5°C; with the policies in place today, about 2.8°C. The world is not yet on the 1.5°C path.
How this comes up: Paper 2 Section A: a graph or table of the IPCC scenarios to read and explain. Section B: outline why there are several scenarios, or explain the cuts needed for 1.5°C and 2°C.
The chart shows the IPCC's best estimates of global warming under its five emissions scenarios for three periods.
With reference to the chart, explain the implications of the scenarios for meeting the Paris Agreement target of 1.5°C.
Model answer plan
See the mark-by-mark plan — for / against / judgement, with marking guidance — in study mode.