Stronger stratification at Higher Level: This statement is Higher Level only. It explains why warming and melting ice are making the ocean's layers stronger, and shows how to test real ocean data with a statistical test.
Practise this as you read
- Explain how warming and lower salinity strengthen stratification.
- Analyse temperature and oxygen data with Spearman's rank.
Free preview
This is the free notes preview
You're reading the free notes. Aimnova Pro unlocks the full study experience — and you can try it with your first topic free to keep:
- FlashcardsLock in vocabulary and key terms with spaced repetition.
- Practice questionsAnswer exam-style questions and get instant AI marking.
- Mock exams & past-paper vaultSit full mocks and see exactly how examiners award marks.
- Personalised study planA daily plan built around your exam date and weak areas.
A warmer lid on the ocean: Global warming heats the top of the ocean first. The warm surface water gets lighter, so it floats more firmly on the cold water below, and the layers mix even less. Scientists say the stratification has become more intense.
The points to remember
- Global warming heats the ocean surface most.
- Warmer water is less dense, so the light top layer floats more strongly on the cold water below.
- The density difference grows, so stratification gets stronger (more intense).
- The change is greatest in the upper 200 m of the ocean.
- It is happening worldwide: temperature increases have had global effects.
Remember it as: Warmer top, lighter top, stronger layers.
Before warming
- Small difference between top and bottom.
- Storms can mix the layers.
- Nutrients reach the surface.
After warming
- Large difference: a light, warm top.
- Storms mix less deeply.
- Fewer nutrients reach the surface.
Real example: a study of millions of ocean measurements found that the top 200 m of the world's ocean became about 5% more stratified between 1960 and 2018, with the biggest change in the upper layers.
Practice with exam-style questions
Answer exam-style questions and get AI feedback that shows you exactly what examiners want to see in a full-marks response.
Salt matters as well as heat. Fresh water is lighter than salty water, so anything that adds fresh water to the surface makes the layers stronger.
Less salt, and what stronger layers do
- Melting ice caps and ice sheets add fresh water to the sea surface.
- Less salty water is less dense, so it floats and strengthens the layers.
- Around Antarctica, melting ice has reduced the salinity of the surface water.
- Stronger layers mean less mixing: fewer nutrients come up, so less phytoplankton grows.
- Less oxygen goes down, and warm water holds less oxygen anyway: dead zones spread.
- Less mixing also carries less carbon down, weakening the ocean carbon sink.
Remember it as: Fresh and warm on top: nothing mixes, nothing comes up.
Melting
- Warmer ocean water melts the floating ice shelves from below.
Fresher
- The meltwater makes the surface water around Antarctica less salty than it was in the 1950s.
Lighter
- Less salty water is less dense, so it floats on the salty water below and the layers strengthen.
Less mixing
- Less water sinks and mixes, so less oxygen and carbon are carried down into the deep ocean.
Real example: between 1960 and 2010 the world's ocean lost about 2% of its dissolved oxygen. Warmer water holds less oxygen, and stronger layers stop oxygen from reaching deeper water.
You can test the link between temperature and oxygen yourself with real data. The Argo database is one source.
Extracting data from a database
- A database stores millions of real measurements, such as the Argo float records.
- Choose the variables: here temperature, salinity and dissolved oxygen.
- Keep everything else the same: one month, one depth (about 5 m), one ocean.
- Take one value per station, spread over a wide range (here from 5° N to 75° N).
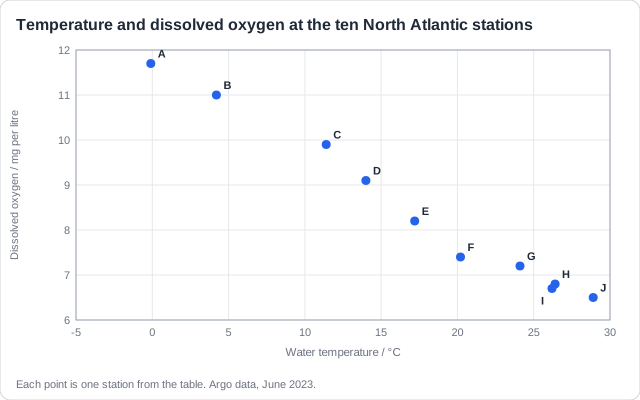
- Put the values in a table, then plot the two variables on a scatter graph.
Remember it as: Same month, same depth, many places.
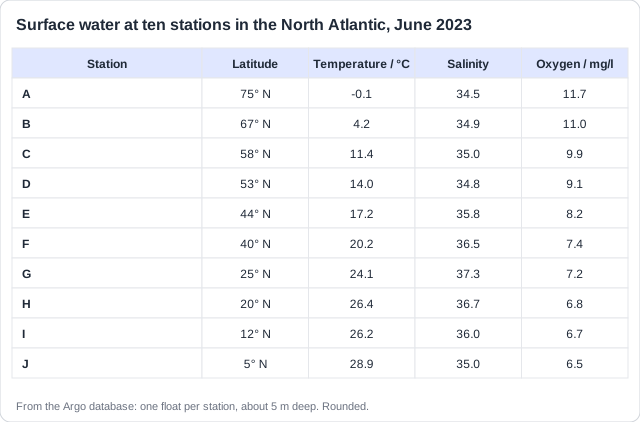
Look at the salinity too. It does not rise steadily with temperature: it is highest (37.3) at 25° N, where hot, dry air evaporates the most water, and lower in the far north, where melting ice and rivers add fresh water.
Feeling unprepared for exams?
Get a clear study plan, practice with real questions, and know exactly where you stand before exam day. No more guessing.
The scatter graph suggests that warmer water holds less oxygen. A statistical test shows whether the pattern is significant.
Spearman's rank, step by step
- To test a relationship between two variables, use Spearman's rank correlation.
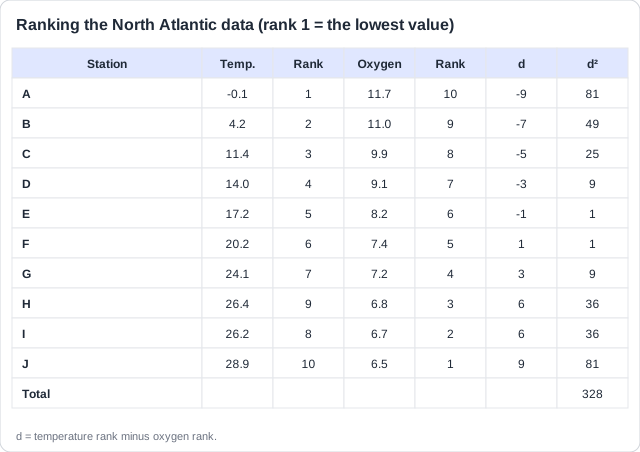
- Rank each variable from lowest to highest.
- For each station find d, the difference between its two ranks, and square it.
- rs = 1 − (6 × Σd²) ÷ (n × (n² − 1)). It runs from −1 to +1.
- If rs (ignoring its sign) is bigger than the critical value, the relationship is significant.
- A significant result shows a relationship, not on its own its cause.
Remember it as: Rank, subtract, square, add, put in the formula, compare.
Formula
rs = 1 − (6 × Σd²) ÷ (n × (n² − 1)), with Σd² = 328 and n = 10 stations.
Work it out
rs = 1 − (6 × 328) ÷ (10 × 99) = 1 − 1968 ÷ 990 = −0.99.
Compare
The critical value for 10 pairs at the 5% level is 0.648. 0.99 is bigger, so the result is significant.
Conclude
There is a strong, significant negative correlation: warmer surface water holds less oxygen, so a warming ocean will hold less.
How this comes up: Paper 2, Section A: a depth graph with 'outline one impact of global warming on density' [1], or a table of data where you name a statistical test and interpret its result.
The upper 200 m of the world's ocean became about 5% more stratified between 1960 and 2018.
Explain how global warming has increased the intensity of ocean stratification.
Model answer plan
See the mark-by-mark plan — for / against / judgement, with marking guidance — in study mode.