Simpson's index at Higher Level: The same formula and methods as SL, with different real cases: a seagrass bed, Formby's sand dunes and the smelters of Sudbury, Canada.
Practise this as you read
- Calculate D from any table, formula first.
- Explain how a study is designed to show a human impact.
Free preview
This is the free notes preview
You're reading the free notes. Aimnova Pro unlocks the full study experience — and you can try it with your first topic free to keep:
- FlashcardsLock in vocabulary and key terms with spaced repetition.
- Practice questionsAnswer exam-style questions and get instant AI marking.
- Mock exams & past-paper vaultSit full mocks and see exactly how examiners award marks.
- Personalised study planA daily plan built around your exam date and weak areas.
Simpson's reciprocal index puts richness and evenness into one number, D. It lets you compare two ecosystems, or one ecosystem over time.
The formula: D = N(N − 1) ÷ Σn(n − 1)
What each symbol means
- N = the total number of individuals of all species.
- n = the number of individuals of one species.
- Σ means add up: work out n(n − 1) for every species, then add them.
- A higher D means more diversity: more species (richness), more similar numbers (evenness).
- The lowest possible D is 1: a sample with only one species.
Worked example 1: one species dominates: A quadrat in a seagrass bed holds 18 eelgrass shoots and 2 sea hares, so N = 20.
D = (20 × 19) ÷ [(18 × 17) + (2 × 1)] = 380 ÷ 308 = 1.23.
D is low, close to 1: there are two species, but almost every individual is eelgrass.
Remember it as: Everyone on top, each species underneath: N(N − 1) over the sum of n(n − 1).
Practice with exam-style questions
Answer exam-style questions and get AI feedback that shows you exactly what examiners want to see in a full-marks response.
Use the same five steps every time, and show the working: the first mark goes for putting the numbers into the formula, and the answer alone may not earn both marks.
Five steps
- Write the formula first: D = N(N − 1) ÷ Σn(n − 1).
- Add every species to get N, then work out N(N − 1).
- For each species, work out n(n − 1). A species with 1 individual gives 0.
- Add these up to get Σn(n − 1).
- Divide the top by the bottom and give D to 2 decimal places.
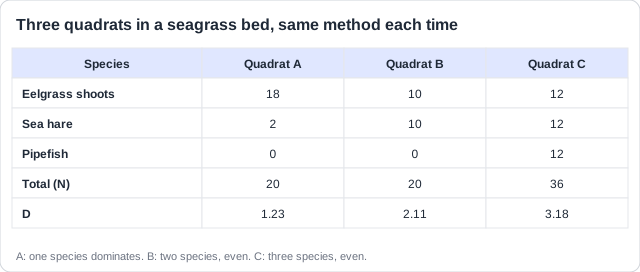
Worked example: sample C: Three species, 12 of each, so N = 36.
D = (36 × 35) ÷ [(12 × 11) + (12 × 11) + (12 × 11)] = 1260 ÷ 396 = 3.18.
Uneven: sample A
- 18 eelgrass, 2 sea hares
- N = 20
- D = 1.23: one species dominates
Even: sample B
- 10 eelgrass, 10 sea hares
- N = 20
- D = 2.11: higher, same total
What D tells you: Same N, but more even numbers: higher D. More species, all even: higher still.
D is never below 1. A perfectly even sample scores a little above its number of species.
Sample both areas the same way: You cannot count every organism, so you sample each area in exactly the same way, then calculate D for each and compare.
The method
- Choose sample points at random (a grid and random numbers) or systematically along a transect.
- Fit the method to the organism: quadrats (plants), pitfall traps (ground animals), kick sampling (river animals), soil samples.
- Take several samples at each site and pool them.
- Count the individuals of each species. Identify them with a key, or just tell them apart (A, B, C).
- Standardise: same quadrat size, effort, time of day and season at both sites.
- Return the animals, then calculate D for each site: the higher D, the more diverse.
Real example: at Formby's sand dunes in north-west England, students run a belt transect from the beach inland, with a 1 m² quadrat every 10 m, and calculate D for each dune zone.
What makes it less accurate
- Sample points not chosen at random: the sample is biased.
- Too few samples, or samples of the wrong size or in the wrong place.
- Misidentification: look-alike species and young stages.
- The two sites sampled on different days, at different times or in different seasons.
- Small, fast or burrowing animals are easily missed.
Not the Lincoln index: The Lincoln index estimates the size of one population. It does not measure diversity, so do not use it in a diversity question.
Feeling unprepared for exams?
Get a clear study plan, practice with real questions, and know exactly where you stand before exam day. No more guessing.
D turns a survey into a number that can be compared: two ecosystems, or one ecosystem over time.
Why it is measured
- Compare different ecosystems objectively, with one number each.
- Monitor change in one ecosystem over time: is diversity rising or falling?
- Spot ecosystems under threat, and judge whether conservation is working.
Studying a human impact: To show that an activity (a mine, a road, a quarry) changed biodiversity, design the study so the activity is the only difference.
The techniques, and why
- Sample before and after the activity, or near and far from it, so change is linked to it, not to disease or weather.
- Run a transect away from the source (a mine, a road) to see change with distance and edge effects.
- Use random or systematic quadrats in affected and unaffected areas; record abundance or percentage cover.
- Repeat over time and distance for reliability.
- Measure abiotic factors too (pH, light, temperature): the activity may have changed them.
- Use indicator species and D, which combines richness and evenness, so sites can be compared.
Real example: around the nickel smelters of Sudbury, Canada, plant surveys at increasing distances found very few species near the smelters. After emissions were cut and the soil was limed from 1978, repeat surveys showed plants returning.
In a [7] answer: Name the ecosystem, and give the purpose of each technique, not just its name. Mobile animals are counted by mark-recapture: that gives one population, not diversity.
How this comes up: Calculate D from a table [2]; outline how diversity is measured [4]; describe a sampling method, or a factor that lowers its accuracy [1-4]; describe methods along a river [7]; explain techniques to study a human impact on a named ecosystem [7].
A company plans a limestone quarry next to a flower-rich grassland.
Explain how ecological techniques could be used to study the impact of the quarry on the plant biodiversity of a named ecosystem.
Model answer plan
See the mark-by-mark plan — for / against / judgement, with marking guidance — in study mode.
Where marks are lost: No named ecosystem: [5] at most. Naming techniques without saying why they are used also loses marks.