Ecological efficiency at Higher Level: An HL-only statement: the percentage of energy passed from one trophic level to the next, worked out from real data, and why the famous 10% is only a rough guide.
Practise this as you read
- Calculate ecological efficiency from a food chain, formula first.
- Explain why efficiency differs between species, levels and ecosystems.
Free preview
This is the free notes preview
You're reading the free notes. Aimnova Pro unlocks the full study experience — and you can try it with your first topic free to keep:
- FlashcardsLock in vocabulary and key terms with spaced repetition.
- Practice questionsAnswer exam-style questions and get instant AI marking.
- Mock exams & past-paper vaultSit full mocks and see exactly how examiners award marks.
- Personalised study planA daily plan built around your exam date and weak areas.
How much energy is passed on: Ecological efficiency tells you how much of a level's energy reaches the level above it.
It is always worked out between two neighbouring levels, from the energy each one receives.
The formula: Ecological efficiency (%) = (energy passed on to the next level ÷ energy received by this level) × 100
The points to remember
- Ecological efficiency = the percentage of the energy received by one trophic level that is passed on to the next.
- Formula: (energy passed to the next level ÷ energy received by this level) × 100.
- It is always low, because energy is lost at every step: heat from respiration, parts not eaten, faeces (2.2.12).
- Energy not passed on is not destroyed: it leaves as heat or goes to the decomposers.
- Low efficiency is why food chains have only 4 or 5 levels (2.2.14).
Remember it as: Up the chain: top over bottom, times 100.
Example: if zooplankton receive 1,000 kJ and pass 60 kJ on to the fish that eat them, the ecological efficiency is (60 ÷ 1,000) × 100 = 6%.
Stop wasting time on topics you know
Our AI identifies your weak areas and focuses your study time where it matters. No more overstudying easy topics.
Questions give a food chain with the energy at each level, often beside a column you do not need. Four steps work every time.
Working it out from data
- Find the two levels the question names, and read their energy values.
- Divide the higher level by the lower level: the one that receives by the one that gives.
- Multiply by 100 and add the % sign.
- Both values must be in the same units; ignore any other column, such as a pollutant.
- The answer is always below 100%; above 100% means the division is the wrong way round.
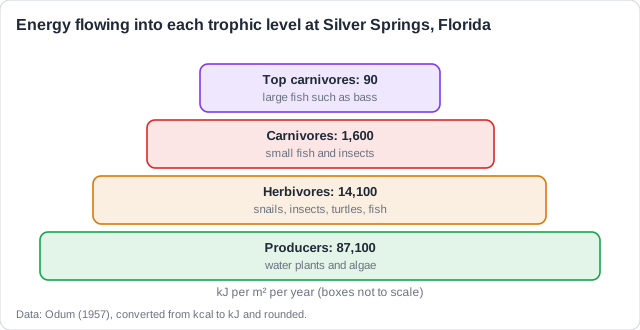
Worked example: Silver Springs: Producers to herbivores = (14,100 ÷ 87,100) × 100 = 16%.
Herbivores to carnivores = (1,600 ÷ 14,100) × 100 = 11%.
Carnivores to top carnivores = (90 ÷ 1,600) × 100 = 6%.
Three steps in one river give three different percentages, and none of them is exactly 10%.
Common slips: Dividing the lower level by the higher one gives an answer over 100%, which is impossible. Subtracting the two values gives the energy lost, not the efficiency.
The '10% rule' is often taught as a law, but it is not: the real percentage changes from place to place and from step to step.
Why 10% is not a rule
- Efficiency varies between ecosystems, between trophic levels and between species.
- Values of about 5-20% are common.
- 10% is neither a fixed amount nor a true average: it is only a rough rule of thumb.
- Always work out the percentage from the data; never assume 10%.
| It varies between | Higher efficiency | Lower efficiency |
|---|---|---|
| Species | Insects, fish: they do not keep warm, so less is lost as heat | Birds, mammals: they burn most of their food keeping warm |
| Trophic levels | Carnivores: meat is easy to digest | Herbivores: tough plant fibre leaves as faeces |
| Ecosystems | Oceans: phytoplankton are eaten whole | Forests, grasslands: wood and roots are left uneaten |
Real example: at Silver Springs the efficiency falls from 16% to 6% up the chain. The top carnivores are large, active fish that hunt, so they use more of their food in respiration.
See how examiners mark answers
Access past paper questions with model answers. Learn exactly what earns marks and what doesn't.
How this comes up: Paper 2, Section A: a food chain with energy values. Calculate the efficiency of one transfer [1], sometimes followed by why it differs from another transfer [2].
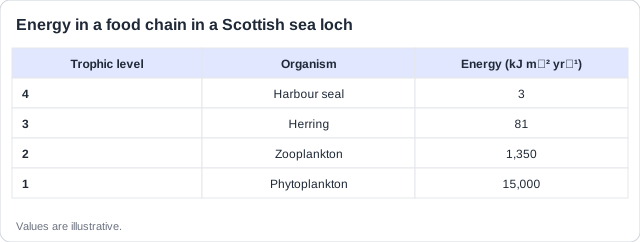
Figure 1 shows the energy in each trophic level of a food chain in a Scottish sea loch.
Calculate, as a percentage, the ecological efficiency of the transfer from zooplankton to herring.
Model answer plan
See the mark-by-mark plan — for / against / judgement, with marking guidance — in study mode.
The transfer from herring to harbour seals is only (3 ÷ 81) × 100 = 3.7%. A follow-up part may ask why.
Figure 1 shows the energy in each trophic level of a food chain in a Scottish sea loch.
Explain why the ecological efficiency from herring to harbour seals is lower than from phytoplankton to zooplankton.
Model answer plan
See the mark-by-mark plan — for / against / judgement, with marking guidance — in study mode.