NPP and food chains at Higher Level: An HL-only statement that ties 2.2.23 and 2.2.24 together: why only NPP can feed the consumers, what it means for biomes, farms and forests, and how to work out productivity from a table.
Practise this as you read
- Explain why NPP, not GPP, is the food available to consumers.
- Calculate NPP, NSP and a percentage from data.
Free preview
This is the free notes preview
You're reading the free notes. Aimnova Pro unlocks the full study experience — and you can try it with your first topic free to keep:
- FlashcardsLock in vocabulary and key terms with spaced repetition.
- Practice questionsAnswer exam-style questions and get instant AI marking.
- Mock exams & past-paper vaultSit full mocks and see exactly how examiners award marks.
- Personalised study planA daily plan built around your exam date and weak areas.
The food supply of a whole ecosystem: Net primary productivity (NPP) is the new plant material added each year. It is the quantity of carbon compounds sustainably available to primary consumers, so it is the base of every food chain.
The points to remember
- Producers use part of their GPP in their own respiration; it is lost as heat.
- What is left, NPP, is stored as new plant biomass (carbon compounds).
- Only this new biomass can be eaten, so NPP is the food available to primary consumers.
- Eating up to the NPP leaves the plants themselves intact: it is sustainable.
- Eat more than the NPP and the plants shrink, so next year's NPP falls.
Remember it as: Eat the growth, not the plant.
Real example: in the Serengeti, Tanzania, the new growth of the grasses after the rains feeds about 1.3 million migrating wildebeest, plus zebra and gazelle. The herds move on as the grass is eaten.
Not GPP: GPP is not available to consumers: the producers have already used part of it in respiration. Say NPP.
Learn what examiners really want
See exactly what to write to score full marks. Our AI shows you model answers and the key phrases examiners look for.
Because NPP is the food supply at the base, the NPP of a biome sets how much life it can feed.
The points to remember
- High NPP (rainforests, estuaries, reefs): more food per m² for primary consumers.
- Low NPP (tundra, deserts): little food per m², so few consumers, spread over large areas.
- Not all NPP is eaten: much falls as dead leaves and feeds decomposers instead.
- More NPP at the base means more energy for every level above.
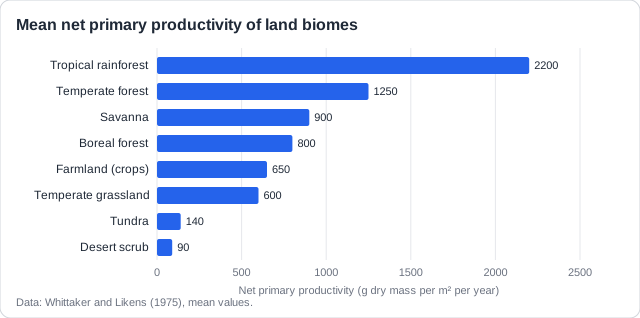
Real example: on the Arctic tundra, NPP is only about 140 g per m² per year, so herds of caribou must travel hundreds of kilometres a year to find enough to eat.
People are primary consumers too. Farming and forestry are ways of harvesting NPP.
The points to remember
- NPP is the plant growth that can be harvested sustainably.
- In natural ecosystems, primary consumers (grazers) harvest it.
- In farming, people harvest crops and hay; in forestry, timber.
- Take no more than the NPP and the stock of plants stays the same.
- The largest sustainable harvest is the maximum sustainable yield (2.2.26).
Sustainable
- Harvest ≤ NPP
- Plant stock stays the same
- The same harvest next year
Unsustainable
- Harvest > NPP
- Plant stock shrinks
- Less NPP, smaller harvests
Real example: people now use about a quarter of all the NPP on land, through crops, grazing, timber and land clearance. In Finland, forests grow about 100 million cubic metres of wood a year, and the harvest is kept below that growth.
Never wonder what to study next
Get a personalized daily plan based on your exam date, progress, and weak areas. We'll tell you exactly what to review each day.
Productivity questions give a table and ask for GP, NP or a percentage. Use these formulas.
The four formulas
- NPP = GPP - R (producers).
- GSP = food eaten - faecal loss (consumers).
- NSP = GSP - R (consumers).
- % of NPP used = (amount taken ÷ NPP) × 100.
- Same units all through, and write the formula before the numbers.
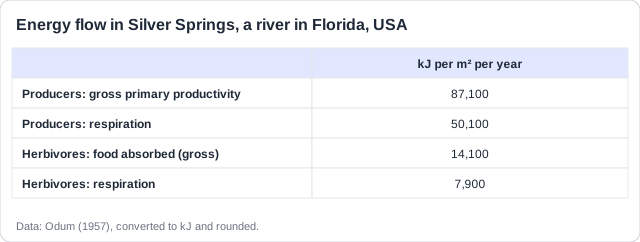
Worked example: NPP = GPP - R = 87,100 - 50,100 = 37,000 kJ m⁻² yr⁻¹.
NSP of herbivores = GSP - R = 14,100 - 7,900 = 6,200 kJ m⁻² yr⁻¹.
% of NPP absorbed by herbivores = (14,100 ÷ 37,000) × 100 = 38%.
The other 62% of the NPP was not eaten by herbivores: it died and fed the river's decomposers, or washed downstream.
How this comes up: Paper 2, Section A: a table or graph of productivity. Calculate NPP [1], then explain what it means for the consumers [2-3].
Figure 1 shows the mean net primary productivity of eight land biomes.
Explain why the tundra supports far fewer primary consumers per square metre than tropical rainforest.
Model answer plan
See the mark-by-mark plan — for / against / judgement, with marking guidance — in study mode.