aımnova
DashboardMy LearningPaper MasteryStudy Plan

Aimnova site navigation

Stay in the loop

Get the latest study resources and updates

New features, study tips and exam insights — straight to your inbox.

IB Diploma

  • IB Past Papers
  • IB Study Notes
  • IB Question Bank
  • IB Mock Exams
  • IB Revision

IB Subjects

  • IB Math AA
  • IB Math AI
  • IB Economics
  • IB Business Management
  • IB Physics
  • IB Biology
  • View all IB subjects→

IB Past Papers

  • IB Math AA HL Past Papers
  • IB Math AA SL Past Papers
  • IB Math AI HL Past Papers
  • IB Math AI SL Past Papers
  • IB Economics HL Past Papers
  • IB Economics SL Past Papers
  • IB ESS Past Papers
  • View all past papers→

Study Resources

  • Study Notes
  • Question Bank
  • Mock Exams
  • Flashcards
  • Revision Guide
  • Exam Skills
  • Command Terms
  • Grade Calculator
  • Exam Timetable 2026

Aimnova

  • Features
  • Pricing
  • For Teachers
  • For Schools
  • For Parents
  • About Us
  • Blog
  • Contact
aımnova

IB study, practice and feedback built around the real exam.

TermsPrivacyCookies·© 2026 Aimnova. All rights reserved.1b845d5

Aimnova is not affiliated with or endorsed by the International Baccalaureate Organization (IB).

NotesEnglish A: Lang & LitTopic 2.4Text type: the infographic
Back to English A: Lang & Lit Topics
2.4.14 min read

Text type: the infographic

IB English A: Language and Literature · Unit 2

Smart study tools

Turn reading into results

Move beyond passive notes. Answer exam-style questions, get AI feedback, and build the skills that earn top marks.

Get Started Free

Contents

  1. 1What is an infographic?
  2. 2Try it yourself
The big idea: An infographic tells a story with facts and pictures together — numbers, icons, colour and a few words. So you must analyse the visuals as closely as the words.

You've swiped past hundreds — the colourful ‘Did you know?’ posts packed with big numbers and little icons.

A giant ‘8 million’, a red arrow, a tiny wallet leaking coins.

The design isn't decoration — the colour, size and layout are choices, each doing a job.

What to look for

1

Big numbers

A huge stat grabs the eye and makes the scale feel shocking.

2

Colour coding

Green = good, red = danger; brand colours for trust.

3

Icons

A heart, a tree, a warning sign — makes an idea instant.

4

Visual hierarchy

Size and position decide what you see first — the top, biggest item is the main message.

Big numbers · colour · icons · hierarchy

The key move: Show how a word and a visual work as a pair: ‘rising’ beside an upward red arrow makes a threat feel unstoppable. Always ask: what does the design add?

Free preview

This is the free notes preview

You're reading the free notes. Aimnova Pro unlocks the full study experience — and you can try it with your first topic free to keep:

  • FlashcardsLock in vocabulary and key terms with spaced repetition.
  • Practice questionsAnswer exam-style questions and get instant AI marking.
  • Mock exams & past-paper vaultSit full mocks and see exactly how examiners award marks.
  • Personalised study planA daily plan built around your exam date and weak areas.
Start Studying Free Full access to Aimnova Pro · cancel anytime
Why it matters in the exam: An infographic can be set in Paper 1 as the page itself. A strong answer analyses the design choices (colour, size, icons, layout) alongside the words.
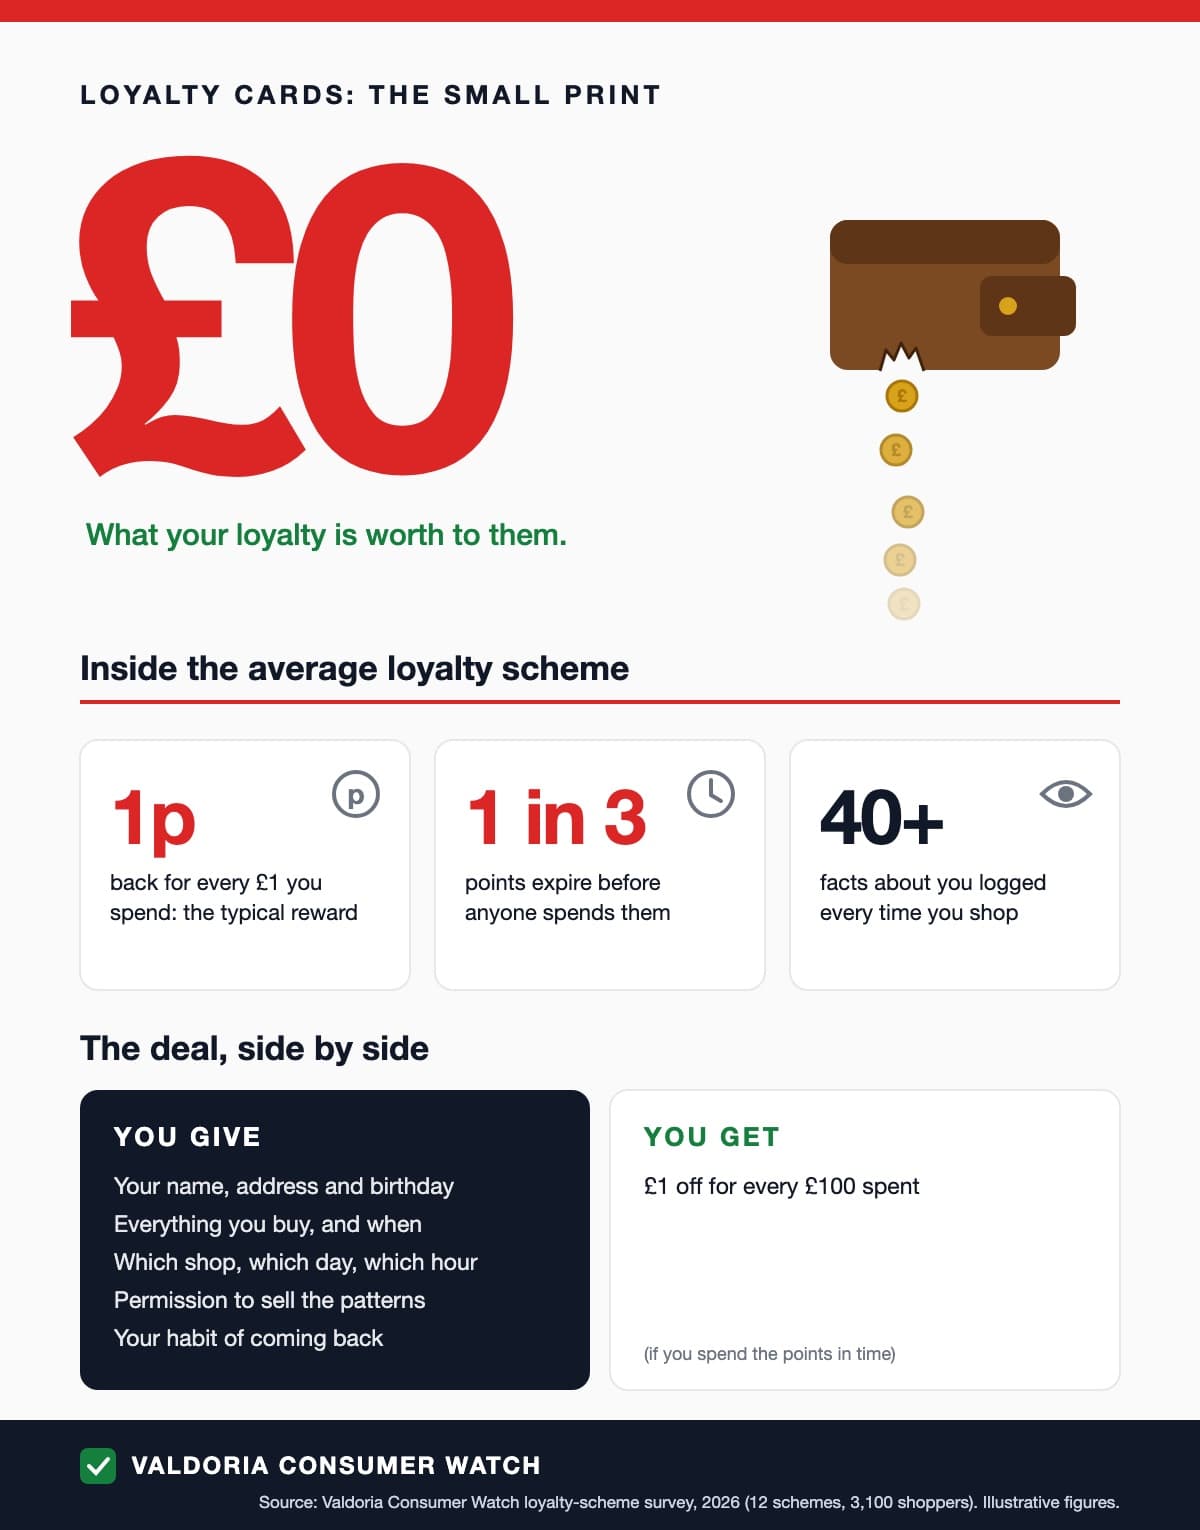
An infographic titled ‘Loyalty cards: the small print’. At the top, a huge red ‘£0’; under it, a small green line, ‘What your loyalty is worth to them.’; to the right, a small brown wallet with a tear in its bottom edge and gold £ coins dripping out, each paler than the last. Below, ‘Inside the average loyalty scheme’: three tiles, ‘1p back for every £1 you spend’, ‘1 in 3 points expire before anyone spends them’, ‘40+ facts about you logged every time you shop’. Then ‘The deal, side by side’: a dark box, ‘You give’, listing five things (name, address and birthday; everything you buy; which shop, day and hour; permission to sell the patterns; your habit of coming back) beside a white box, ‘You get’, with one line, ‘£1 off for every £100 spent’, and empty space. Footer: Valdoria Consumer Watch, with a source line (survey, 2026, 3,100 shoppers).
Consumer-group infographic (an original text written for Aimnova; figures illustrative)
IB-style questionAnalyse[6 marks]

Analyse how this infographic uses visuals and words to persuade shoppers.

Model answer plan

See the mark-by-mark plan — for / against / judgement, with marking guidance — in study mode.

Claim your free topic
Watch out: Don't analyse only the words — the visuals are half the text. And ‘it uses colour’ means nothing without the meaning attached.

IB Exam Questions on Text type: the infographic

Practice with IB-style questions filtered to Topic 2.4.1. Get instant AI feedback on every answer.

Practice Topic 2.4.1 QuestionsBrowse All English A: Lang & Lit Topics

How Text type: the infographic Appears in IB Exams

Examiners use specific command terms when asking about this topic. Here's what to expect:

  • Define

    Give the precise meaning of key terms related to Text type: the infographic.

    AO1
  • Describe

    Give a detailed account of processes or features in Text type: the infographic.

    AO2
  • Explain

    Give reasons WHY — cause and effect within Text type: the infographic.

    AO3
  • Evaluate

    Weigh strengths AND limitations of approaches in Text type: the infographic.

    AO3
  • Discuss

    Present arguments FOR and AGAINST with a balanced conclusion.

    AO3

See the full IB Command Terms guide

Related English A: Lang & Lit Topics

Continue learning with these related topics from the same unit:

2.1.1Text type: the advertisement2.1.2Text type: the poster2.1.3Text type: the brochure or leaflet2.1.4Text type: the campaign material
View all English A: Lang & Lit topics
Improve your exam techniqueCommand terms, paper structure, and mark-scheme tips for English A: Lang & Lit
Previous2.3.4Text type: the transcriptNextText type: the political cartoon2.4.2

4 practice questions on Text type: the infographic

Students who practiced this topic on Aimnova scored 82% on average. Try free practice questions and get instant AI feedback.

Try 3 Free QuestionsView All English A: Lang & Lit Topics