Key idea: Smoking is a clear case of prevalence changing over time, and of rates that differ between groups in the same country.
In Britain about 45% of adults smoked in 1974. By 2022 about 13% of adults in the UK smoked, according to official surveys. Rates are still far higher among people in routine and manual jobs than in managerial and professional ones.
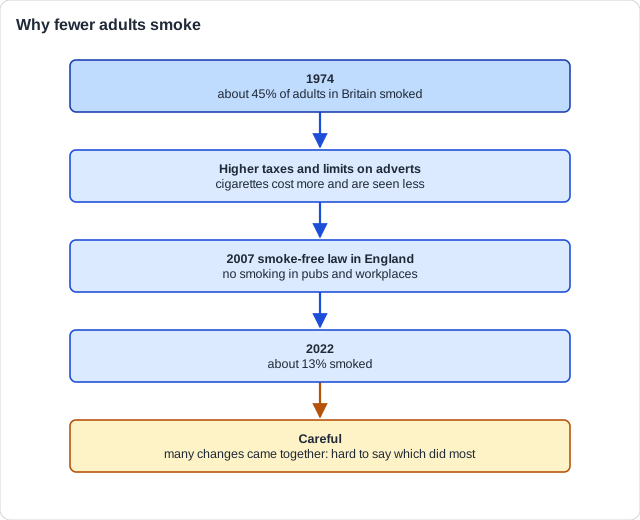
Why prevalence fell
Price
Higher taxes made cigarettes expensive.
Visibility
Adverts were limited, then banned, so smoking was seen less.
Places
Smoke-free laws removed smoking from pubs and workplaces.
Norms
Smoking stopped being seen as normal or attractive.
Price · Visibility · Places · Norms
What HL adds: Paper 3 sources often give prevalence as a graph over time. Say what the graph shows, then one limit on reading it: a correlation in time is not a cause.
Free preview
This is the free notes preview
You're reading the free notes. Aimnova Pro unlocks the full study experience — and you can try it with your first topic free to keep:
- FlashcardsLock in vocabulary and key terms with spaced repetition.
- Practice questionsAnswer exam-style questions and get instant AI marking.
- Mock exams & past-paper vaultSit full mocks and see exactly how examiners award marks.
- Personalised study planA daily plan built around your exam date and weak areas.
Key idea: Differences between groups point to stress, norms and money; most of the evidence is correlational.
Explanations
- Stress: smoking used to cope with strain
- Social learning: smoking seen as normal
- Less help to quit in poorer areas
Where to be careful
- Surveys show links, not causes
- Self-report: people may hide smoking
- Many factors travel together
The fall over time affected every group, which shows that environments set prevalence. The gap between groups stayed, which suggests stress and norms still matter.
Watch out: Give the figures, then explain them. A prevalence answer without numbers stays vague.