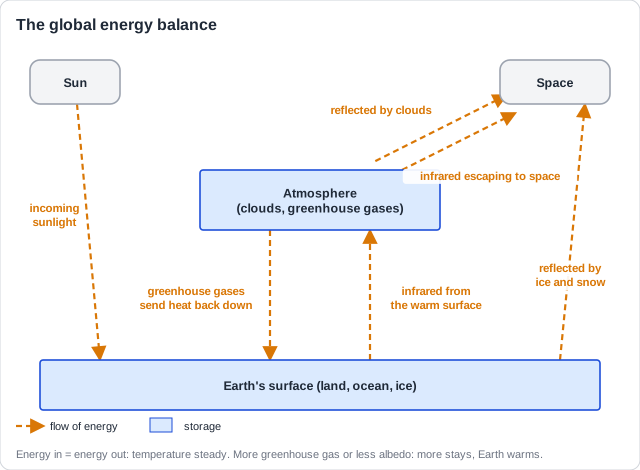
Energy in, energy out: Earth's temperature is set by its energy balance. When the two are equal, global temperature stays steady.
The points to remember
- Sunlight (short-wave) arrives; some is reflected straight back by clouds, ice and snow.
- How much a surface reflects is its albedo: fresh snow is high, dark ocean is low.
- The rest is absorbed; the warm surface gives off infrared (long-wave) heat.
- Greenhouse gases absorb infrared and send some back down, keeping Earth warm.
- More greenhouse gas, or a lower albedo, keeps more energy in: an imbalance, so Earth warms.
Real example (SL): NASA's CERES satellites. Since 2000 these satellites have measured the energy arriving at and leaving Earth. They found that the imbalance, the extra energy kept each year, roughly doubled between 2005 and 2019.
Free preview
This is the free notes preview
You're reading the free notes. Aimnova Pro unlocks the full study experience — and you can try it with your first topic free to keep:
- FlashcardsLock in vocabulary and key terms with spaced repetition.
- Practice questionsAnswer exam-style questions and get instant AI marking.
- Mock exams & past-paper vaultSit full mocks and see exactly how examiners award marks.
- Personalised study planA daily plan built around your exam date and weak areas.
The input to the system, sunlight, is not quite constant. Small natural changes in it can start a change in climate, which feedback loops then make bigger.
The points to remember
- The Sun's output rises and falls by about 0.1% over an 11-year sunspot cycle.
- Slow changes in Earth's orbit and tilt, over tens of thousands of years, change where sunlight falls. They set off ice ages.
- Feedback loops amplify the small start: more ice reflects more sunlight; colder oceans take up more carbon dioxide.
- The Sun's output has not risen since the 1950s, but global temperature has, so recent warming is not caused by the Sun.
Real example (SL): the Maunder Minimum. From 1645 to 1715 astronomers saw almost no sunspots. Europe had many bitter winters then; London's River Thames froze so hard that frost fairs were held on the ice.
A common slip: Do not blame today's warming on the Sun. Its output has been flat or slightly lower since the 1950s, while temperatures rose.
Memorize terms 3x faster
Smart flashcards show you cards right before you forget them. Perfect for definitions and key concepts.
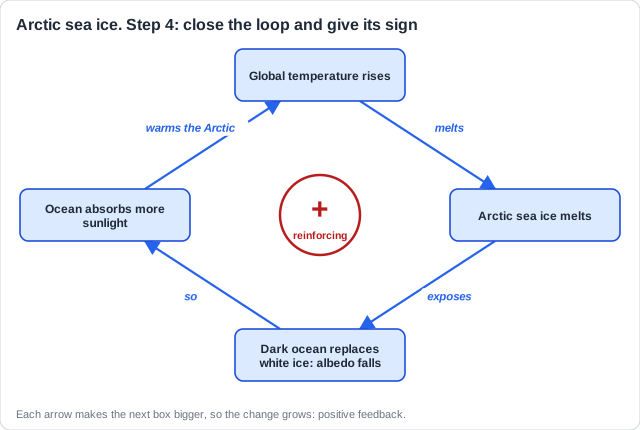
A feedback loop is drawn in four steps. Here is the ice-albedo loop for Arctic sea ice.
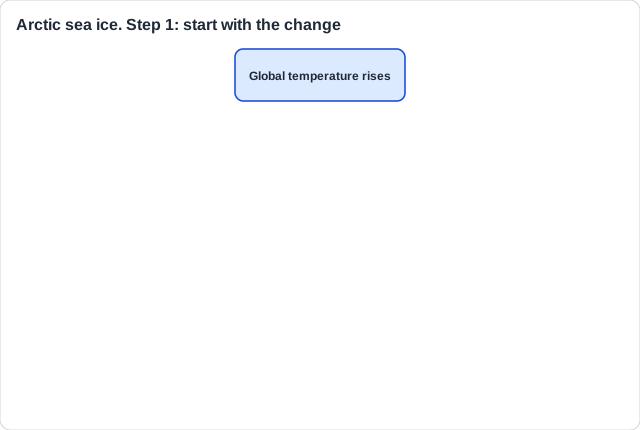
Draw an arrow to what it causes, and write the link on the arrow.
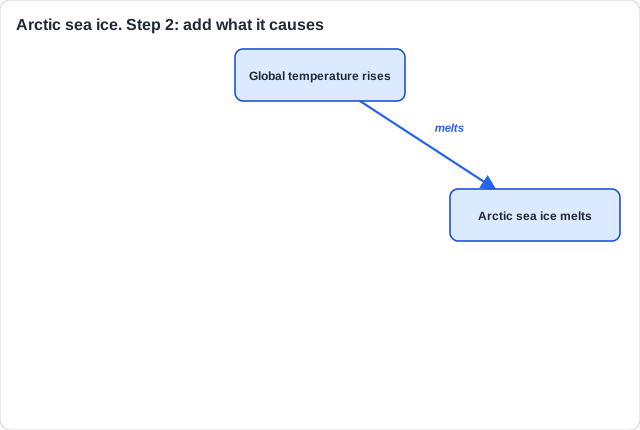
Keep adding effects until the next one changes temperature again.
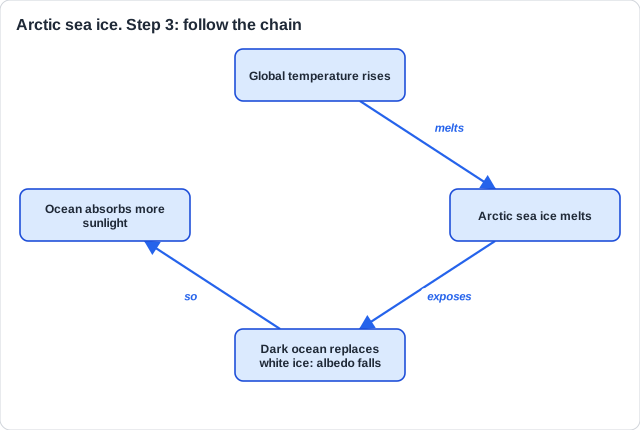
Close the loop back to the start. Each step makes the change bigger, so it is positive.
The points to remember
- Start with the change (temperature rises).
- Each box is one effect; each arrow is labelled.
- The last arrow returns to the start: an open chain is not a loop.
- Amplifies the change: positive. Reverses it: negative.
Real example (SL): the area of Arctic sea ice left each September has shrunk by about 12% a decade since 1979. In 2025 it fell to 4.60 million km², and the 19 lowest years on record are all from 2007 on.
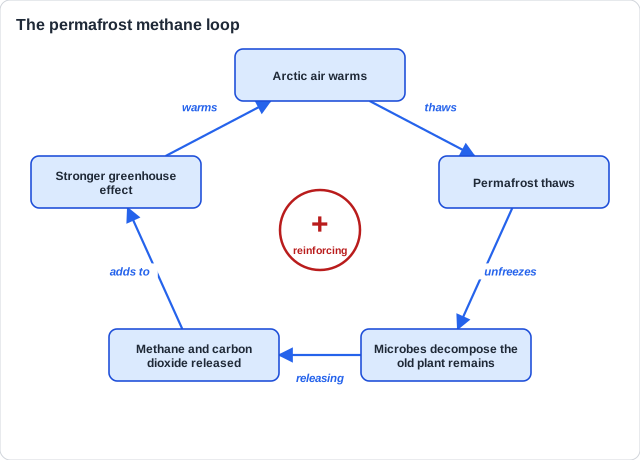
Permafrost holds the frozen remains of plants that lived thousands of years ago. Thawing it starts a methane loop.
The points to remember
- Northern permafrost holds about 1,500 billion tonnes of carbon, about twice what is in the air now.
- When it thaws, microbes decompose the remains, releasing methane and carbon dioxide.
- Methane traps about 80 times more heat than carbon dioxide over 20 years.
- Methane hydrates can break down as the water warms.
- More greenhouse gas means more warming and more thawing: a positive loop.
Remember it as: Thaw, rot, release, warm, thaw again.
Real example (SL): the Yamal craters. Since 2014, giant craters up to tens of metres deep have appeared in Siberia's Yamal Peninsula, where methane built up under thawing ground and burst out.
Know your predicted grade
Take timed mock exams and get detailed feedback on every answer. See exactly where you're losing marks.
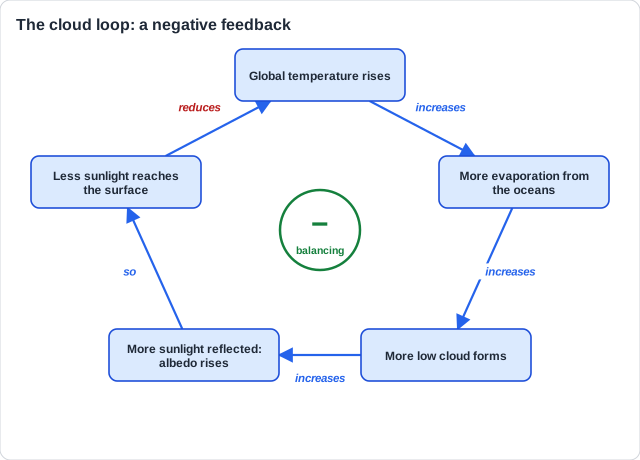
Not every loop speeds warming up. A negative loop works against the change, so it slows it down.
The points to remember
- Clouds: warming increases evaporation; more low cloud raises albedo, reflecting sunlight (negative).
- Plants: more carbon dioxide speeds up photosynthesis, so more carbon is taken up (negative).
- Water vapour: warmer air holds more water vapour, itself a greenhouse gas (positive).
- Today the positive loops are stronger, so overall they add to the warming.
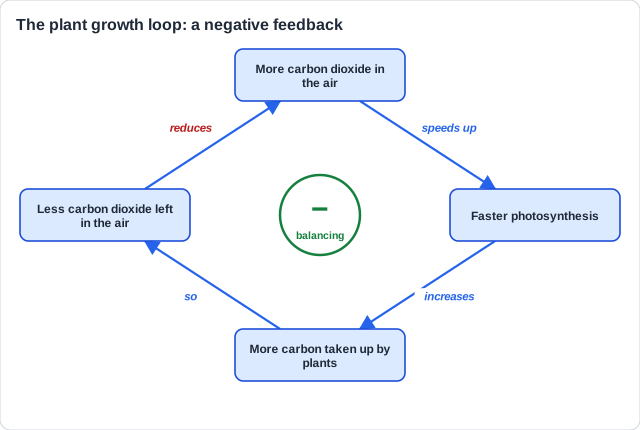
Real example (SL): each year, plants on land take up roughly a quarter or more of the carbon dioxide people emit, and the oceans take up about another quarter. Without these sinks, warming would be much faster.
A systems model joins the causes, the loops and the effects into one picture of cause and effect.
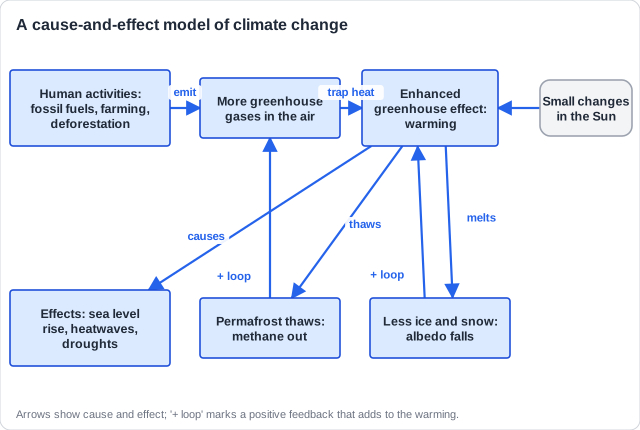
What a model does well
- Shows causes and effects in one picture
- Shows which loops add to or slow warming
- Lets scientists test 'what if' changes
Its limits
- Many loops act at once, with time lags
- The strength of each loop is uncertain
- It simplifies, so it can miss surprises
Real example (SL): the IPCC uses computer models built from these loops to project how warm Earth will be under different emissions.
Get feedback like a real examiner
Submit your answers and get instant feedback — what you did well, what's missing, and exactly what to write to score full marks.
How this comes up: Paper 2 Section B asks you to explain the role of feedback in global warming [7]. Each complete loop earns up to 2 marks; you need both kinds, or you can score only 4.
Since 1979 Arctic sea ice has shrunk, permafrost has begun to thaw and cloud cover has changed.
Explain how negative and positive feedback mechanisms play a role in the process of global warming.
Model answer plan
See the mark-by-mark plan — for / against / judgement, with marking guidance — in study mode.