How do we know about climates no one measured?: Thermometers only go back about 170 years. For older climates, scientists use proxy data.
The points to remember
- Direct measurements: instruments such as thermometers and satellites; precise, but only about 170 years long.
- Proxy data: indirect evidence of past climate kept in natural records.
- The three proxies in the guide: ice cores, tree rings and deposited sediments (also coral bands).
- Proxies reach back thousands to millions of years, long before any instrument.
- Direct records show recent change: about 1.1 °C warmer in 2011-2020 than in 1850-1900; CO2 up from about 280 to 427 ppm.
- Sea level rose about 0.20 m from 1901 to 2018; Arctic sea ice and mountain glaciers are shrinking.
Direct measurements
- Thermometers, tide gauges, satellites
- Precise, measured as it happens
- Only about 170 years
Proxy data
- Ice cores, tree rings, sediments
- Indirect: must be interpreted
- Thousands to millions of years
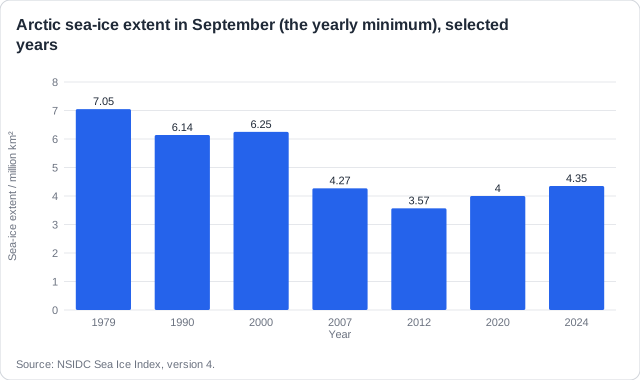
Real example: satellites have measured Arctic sea ice since 1979. Its September extent fell from 7.05 million km² in 1979 to 3.57 million km² in 2012, the lowest so far.
Free preview
This is the free notes preview
You're reading the free notes. Aimnova Pro unlocks the full study experience — and you can try it with your first topic free to keep:
- FlashcardsLock in vocabulary and key terms with spaced repetition.
- Practice questionsAnswer exam-style questions and get instant AI marking.
- Mock exams & past-paper vaultSit full mocks and see exactly how examiners award marks.
- Personalised study planA daily plan built around your exam date and weak areas.
An ice core is the best record of past CO2, because it holds real samples of old air.
The points to remember
- Snow falls on Antarctica or Greenland each year and is pressed into ice, layer on layer.
- The ice traps tiny bubbles of air: samples of the old atmosphere, so CO2 can be measured directly.
- The isotopes (heavier and lighter forms) of hydrogen and oxygen in the ice show the temperature when the snow fell.
- Deeper = older: the age comes from counting layers and from the depth.
- The longest record, from Dome C in Antarctica, covers 800,000 years.
Snow falls
Each winter's snow is buried by the next.
Ice forms
The weight presses the snow into ice, sealing in bubbles of air.
Drill and measure
CO2 from the bubbles; temperature from the isotopes in the ice.
Remember it as: Bubbles for the gas, isotopes for the heat, depth for the date.
Real example: the European EPICA team drilled 3,270 m down into the ice at Dome C, Antarctica, finishing in 2004. The deepest ice is about 800,000 years old.
Feeling unprepared for exams?
Get a clear study plan, practice with real questions, and know exactly where you stand before exam day. No more guessing.
Ice is not the only record. Trees and the mud on lake and ocean floors also lay down a layer each year.
The points to remember
- Tree rings: one ring grows each year; a wide ring = a good (warm, wet) year, a narrow ring = a poor year.
- Counting rings dates each year exactly; old trees and preserved wood give records thousands of years long.
- Deposited sediments settle in layers on lake and ocean floors, the oldest at the bottom.
- In ocean sediments, the shells of tiny plankton record the water temperature when they grew.
- In lake sediments, pollen shows which plants grew, and so what the climate was like.
- Together with ice cores, they show CO2 and temperature rising and falling together.
Ice cores
- CO2 in air bubbles
- Temperature from isotopes
- 800,000 years
Tree rings
- Ring width each year
- Warm, wet years = wide rings
- Thousands of years
Sediments
- Plankton shells, pollen
- Ocean and lake floors
- Up to millions of years
Real example: bristlecone pines in California's White Mountains are the oldest known trees, some about 4,800 years old. Their rings record the climate year by year. Research ships also drill long cores of sediment from the ocean floor.
Name all three: The guide names ice cores, tree rings and deposited sediments. Learn what each one measures.
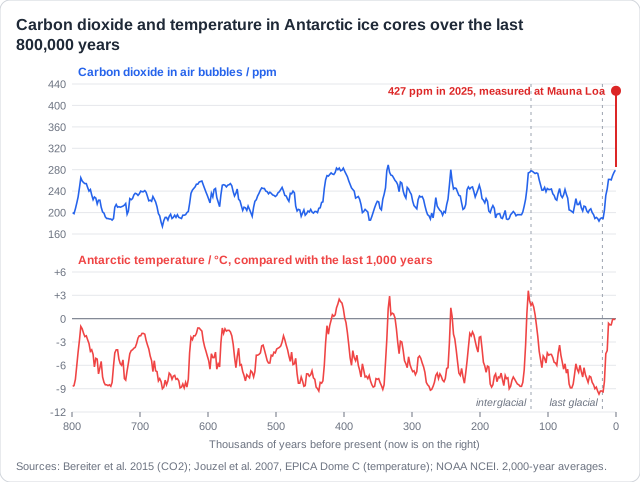
The guide asks you to read graphs of the past 800,000 years. Here is the real ice-core record.
The points to remember
- The record shows glacial cycles: long cold glacials and short warm interglacials, about every 100,000 years.
- In glacials, CO2 fell to about 180-200 ppm and Antarctica was about 8-10 °C colder than today.
- In interglacials, CO2 rose to about 280-300 ppm and temperatures were like today's.
- CO2 and temperature rise and fall together: a positive correlation.
- In 800,000 years CO2 never went above about 300 ppm; in 2025 it was about 427 ppm.
Pattern
Repeated cycles about 100,000 years long.
Relationship
High CO2 goes with warm periods, low CO2 with cold ones: a positive correlation.
Values
Last glacial, about 20,000 years ago: about 190 ppm and about 9 °C colder.
Today
About 427 ppm: over 120 ppm above the highest value in 800,000 years.
Real example: about 125,000 years ago, in the last interglacial, CO2 reached about 285 ppm and Antarctica was a few degrees warmer than today.
Memorize terms 3x faster
Smart flashcards show you cards right before you forget them. Perfect for definitions and key concepts.
A correlation, checked many ways: The records show that CO2 and temperature go together. How sure can we be, and what do they not show on their own?
The points to remember
- A correlation shows two things change together; on its own it does not prove which one causes the other.
- Physics adds the cause: CO2 absorbs heat, so more CO2 means more warming.
- Strengths: proxies cover far longer periods; different proxies agree with each other.
- Limits: they are indirect and must be checked against modern measurements; dates can be uncertain.
- A proxy may record one place, not the whole world; tree rings also respond to rain, not just heat.
- Direct measurements are precise but short; using both together gives the most confidence.
Strengths of proxy data
- Hundreds of thousands of years
- Real samples of old air (ice)
- Different proxies agree
Limits of proxy data
- Indirect: needs interpreting
- Dating can be uncertain
- Often one place, not global
Real example: ice cores from Greenland and Antarctica, at opposite ends of the Earth, show the same ice ages at the same times, so the pattern is not just local.
Correlation is not proof on its own: Say 'positive correlation' for what the data shows. To argue that CO2 causes warming, add the physics: CO2 absorbs and re-emits heat.
Modern ice records are direct measurements. Papers give a chart of ice and ask for a percentage change.
The points to remember
- Percentage decrease = (old - new) / old x 100.
- Read the two values carefully from the right bars.
- Show the working, then give the answer to one decimal place or a whole number.
- A decrease can be written as a minus number (-49.4%) or as 'a decrease of 49.4%'.
Read
September 1979: 7.05 million km². September 2012: 3.57 million km².
Subtract
7.05 - 3.57 = 3.48 million km² lost.
Divide by the old value
3.48 / 7.05 x 100 = 49.4% decrease.
Real example: Swiss glaciers are shrinking too: they lost about 10% of their remaining ice in just two years, 2022 and 2023.
Know your predicted grade
Take timed mock exams and get detailed feedback on every answer. See exactly where you're losing marks.
How this comes up: Paper 2, Section A: a graph of past carbon dioxide and temperature, then short questions that ask you to describe or explain what it shows.
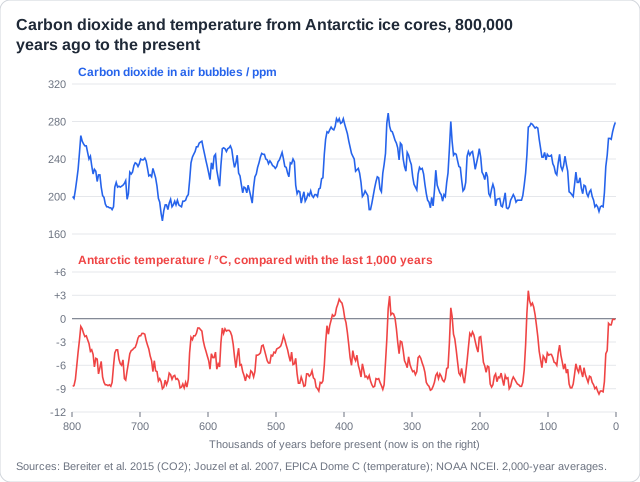
Ice cores drilled at Dome C in Antarctica hold air and ice from the last 800,000 years. The figure shows carbon dioxide and temperature from these cores.
Describe how carbon dioxide and temperature changed during the glacial cycles shown in the figure.
Model answer plan
See the mark-by-mark plan — for / against / judgement, with marking guidance — in study mode.