A natural blanket, made thicker by people: Greenhouse gases keep the Earth warm. Human emissions have added more of them, so they trap more heat.
The points to remember
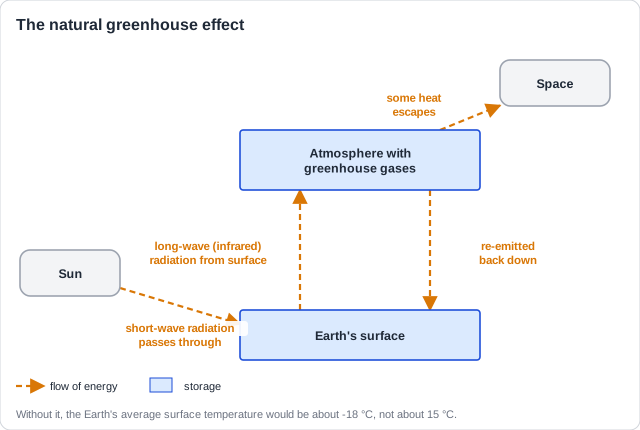
- Short-wave radiation from the Sun passes through the atmosphere and warms the surface.
- The warm surface gives off long-wave (infrared) radiation.
- Greenhouse gases absorb this heat and re-emit some of it back down: the natural greenhouse effect.
- It keeps the Earth at about 15 °C on average instead of about -18 °C: life needs it.
- Human emissions add more greenhouse gas, so more heat is absorbed and re-emitted: the enhanced greenhouse effect.
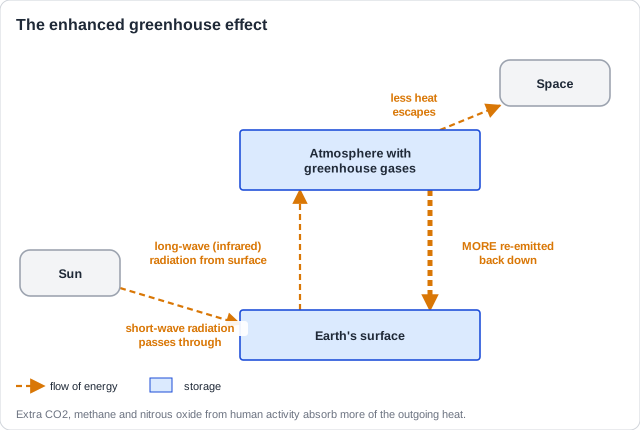
Remember it as: Short-wave in, long-wave out, more gas keeps more in.
Real example: since 1750, the CO2 in the air has risen by about half, from about 280 ppm to about 427 ppm in 2025.
Free preview
This is the free notes preview
You're reading the free notes. Aimnova Pro unlocks the full study experience — and you can try it with your first topic free to keep:
- FlashcardsLock in vocabulary and key terms with spaced repetition.
- Practice questionsAnswer exam-style questions and get instant AI marking.
- Mock exams & past-paper vaultSit full mocks and see exactly how examiners award marks.
- Personalised study planA daily plan built around your exam date and weak areas.
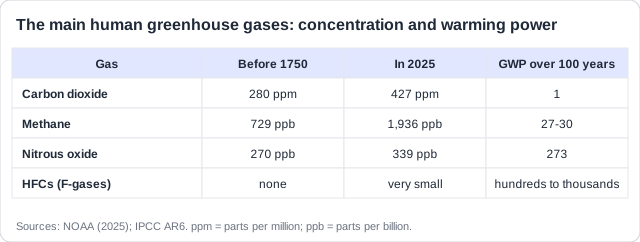
The guide names three gases that people emit in large quantities, and smaller amounts of others. Learn each gas with its human sources.
The points to remember
- Carbon dioxide: burning fossil fuels, deforestation, cement. Up from about 280 to 427 ppm.
- Methane: cattle and sheep (digestion), rice paddies, landfill, gas leaks. More than 2.5 times its 1750 level.
- Nitrous oxide: nitrogen fertilizers, manure, burning fuel. About a quarter higher than in 1750.
- Smaller quantities of other GHGs: F-gases such as HFCs from fridges and air conditioners.
- GWP (global warming potential) compares a gas's warming with the same mass of CO2 over 100 years.
- CO2 has the biggest total effect because there is so much of it: about three-quarters of all emissions.
Real example: in New Zealand, farming is the largest source of greenhouse gases, mostly methane from the digestion of about 10 million cattle and 24 million sheep.
Gas plus source: Link each gas to a human activity: 'methane from the digestion of cattle', not just 'methane'.
Feeling unprepared for exams?
Get a clear study plan, practice with real questions, and know exactly where you stand before exam day. No more guessing.
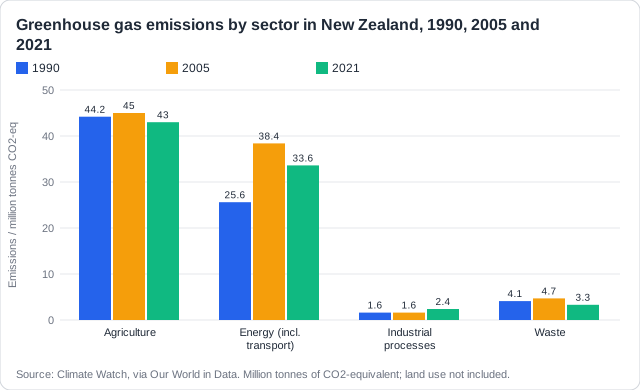
Papers give a chart of a country's emissions by sector and ask which sector contributes most.
The points to remember
- Countries report emissions by sector: energy (including transport), agriculture, industry, waste.
- Read the key first, then compare bar heights for the year asked.
- Agriculture is the biggest sector where farming is big and electricity is clean (New Zealand).
- Energy is the biggest where coal or oil make the electricity (Australia).
- Emissions are given as CO2-equivalent: each gas converted to the CO2 that would cause the same warming.
Real example: New Zealand makes most of its electricity from hydropower, so in 2021 agriculture (43.0 million tonnes CO2-eq) was its largest sector, ahead of energy (33.6).
Answer the year asked: If the question names a year, compare the bars for that year only, and give the sector's name.
Warming first, then a changed climate: The enhanced greenhouse effect leads to global warming, and global warming leads to climate change.
The points to remember
- More GHG means more infrared absorbed and re-emitted, so the global average temperature rises: global warming.
- A warmer atmosphere changes the whole climate: that is climate change.
- More evaporation, so heavier rain in some places and drought in others.
- Winds and precipitation patterns shift; seasons change.
- More extreme weather: heatwaves, storms, hurricanes, floods.
- Warming also melts ice and raises sea level.
More CO2
- Emissions raise the concentration of a greenhouse gas.
More heat kept
- More infrared absorbed and re-emitted.
Global warming
- The average temperature rises.
Climate change
- Evaporation, winds, rain, droughts, storms change.
Real example: the World Meteorological Organization found that 2024 was the first calendar year more than 1.5 °C warmer than before the Industrial Revolution.
Memorize terms 3x faster
Smart flashcards show you cards right before you forget them. Perfect for definitions and key concepts.
The climate has always changed naturally. So how do we know the recent warming is human-made? Check each natural cause against what has happened since 1950.
The points to remember
- Milankovitch cycles: changes in the Earth's orbit and tilt drive ice ages over about 100,000 years: far too slow.
- Solar output varies by only about 0.1% over an 11-year cycle and has not risen since the 1950s.
- Volcanic eruptions cause short-term cooling (aerosols reflect sunlight) for a year or two.
- El Niño and La Niña move heat around for a year or so; they do not add heat over decades.
- So natural factors cannot explain the fast warming since 1950; the rise in greenhouse gases matches it.
Natural causes
- Orbit cycles: about 100,000 years
- Sun: flat since the 1950s
- Volcanoes: cool for 1-2 years
- El Niño: a year or so
Human causes
- Fossil fuels: CO2
- Deforestation: CO2
- Farming: methane, nitrous oxide
- Industry: F-gases, cement CO2
Real example: satellites have measured the Sun's energy output since 1978. It has gone up and down with the 11-year cycle but has not risen, while temperatures have climbed.
Do not say 'the Sun is getting hotter': Solar output has not risen since the 1950s, so it cannot explain the recent warming.
How this comes up: Paper 2, Section A: 'Outline how CO2 emissions can cause a change in the global climate' [2]: a chain from the gas to the climate.
Many countries are still increasing their use of coal for electricity.
Outline how carbon dioxide emissions can cause a change in the global climate.
Model answer plan
See the mark-by-mark plan — for / against / judgement, with marking guidance — in study mode.