One global list: Every species can be given a conservation status. The IUCN assesses it and publishes the result as the IUCN Red List.
The points to remember
- A species' conservation status shows how close it is to extinction.
- Status is assessed globally by the IUCN: the International Union for Conservation of Nature.
- The results are published as the IUCN Red List of Threatened Species.
- Scientists, conservationists, governments and policymakers worldwide use it to set priorities.
Remember it as: Status = how close to extinction. IUCN decides; the Red List shows it.
Who uses the Red List
- Scientists and conservationists: to see which species need help most.
- Governments and policymakers: to write laws and decide where money goes.
- Everyone: it is free to search online, so anyone can check a species.
Real example: by 2024 the IUCN had assessed more than 160 000 species, and over 45 000 of them were threatened with extinction, from sharks to cacti.
Free preview
This is the free notes preview
You're reading the free notes. Aimnova Pro unlocks the full study experience — and you can try it with your first topic free to keep:
- FlashcardsLock in vocabulary and key terms with spaced repetition.
- Practice questionsAnswer exam-style questions and get instant AI marking.
- Mock exams & past-paper vaultSit full mocks and see exactly how examiners award marks.
- Personalised study planA daily plan built around your exam date and weak areas.
The IUCN does not guess. It uses precise criteria and data on five things the guide names.
The five things status is based on
- Number of individuals: how many are left, especially mature (breeding) adults.
- Rate of increase or decrease of the population, e.g. a fall of 80% in three generations.
- Breeding potential: how fast it can reproduce and recover.
- Geographic range: how large the area it lives in is, how many places, how fragmented.
- Known threats, such as habitat loss or hunting, which make a fall likely to go on.
Remember it as: How many, how fast, how fertile, how far, how threatened.
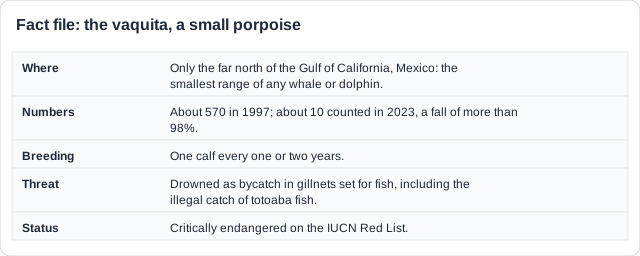
Real example: the vaquita lives only in the far north of the Gulf of California (tiny range). About 570 in 1997 fell to about 10 by 2023 (fast decrease, tiny number). One calf every year or two (low breeding potential). It drowns in gillnets (known threat). So it is critically endangered.
Say it the IUCN way
- The precise IUCN criteria: population size, reduction in size, range (extent of occurrence, area of occupancy).
- Also: habitat fragmentation, habitat quality or loss, and the probability of extinction.
- Always say the size or the direction: 'fewer than 250 adults', 'decreased population', not 'population'.
- A threat on its own (hunting, predators, fire) is a cause, not a criterion: turn it into one, e.g. 'habitat loss'.
- Also accepted: trophic level (top predators are few to begin with) and genetic diversity.
Three answers that score nothing: 'Population' with no size or direction. 'Population density'. A threat alone, such as 'poaching' or 'predation by rats': say what it does, e.g. 'loss of habitat' or 'reduction in population size'.
See how examiners mark answers
Answer exam-style questions with model answers. Learn exactly what earns marks and what doesn't.
The criteria place each species in one rank, from the lowest risk to the highest.
The points to remember
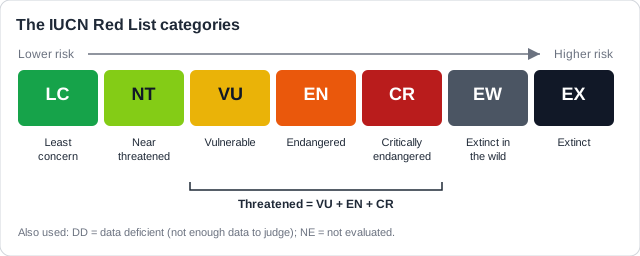
- Seven ranks from lowest to highest risk: LC, NT, VU, EN, CR, EW, EX.
- Threatened means vulnerable, endangered or critically endangered: VU + EN + CR.
- EW, extinct in the wild: it survives only in captivity or cultivation. EX: none left alive.
- DD, data deficient: not enough data to judge. NE: not yet evaluated.
- Each rank has precise thresholds, e.g. critically endangered: fewer than 250 mature adults and still falling.
- When the data change, a species moves up (uplisted) or down (downlisted) a rank.
| Rank | What it means |
|---|---|
| Least concern (LC) | Widespread and common |
| Near threatened (NT) | May become threatened soon |
| Vulnerable (VU) | High risk of extinction in the wild |
| Endangered (EN) | Very high risk |
| Critically endangered (CR) | Extremely high risk |
| Extinct in the wild (EW) | Survives only in captivity or cultivation |
| Extinct (EX) | No individuals remain alive |
Real example: the Tasmanian devil was least concern until a contagious face cancer spread in the 1990s. Numbers fell by about 80%, so in 2008 it was moved up to endangered: a decreased population.
| Criterion | Critically endangered when... |
|---|---|
| Population reduction | It fell by 90% or more in 10 years or three generations (80% if the causes have not stopped) |
| Small range | Extent of occurrence under 100 km², or area of occupancy under 10 km², and fragmented or in one place |
| Small, declining population | Fewer than 250 mature adults and still falling, or no group larger than 50 |
| Very small population | Fewer than 50 mature adults |
| Probability of extinction | At least 50% within 10 years or three generations |
A change needs a change word: Why did a species move up a rank? 'Its population decreased', 'its range was reduced', 'its habitat became more fragmented'. The word decreased, reduced or increased is what earns the mark.
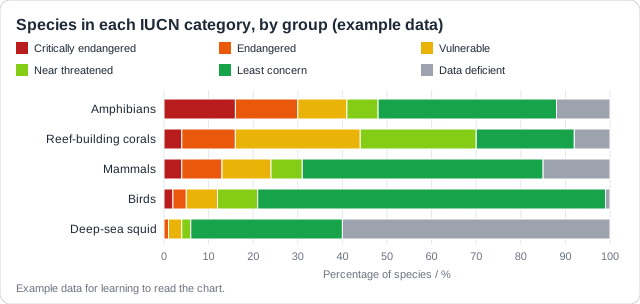
Red List data often come as a bar chart split into ranks, or as a graph of numbers over time.
The points to remember
- Add the three threatened bars: VU + EN + CR. Near threatened is not threatened.
- A percentage is part ÷ whole × 100; always write the % sign.
- Average annual change = change in numbers ÷ number of years.
- Read both values when asked for two years: both are needed for the mark.
- Data deficient groups are hard to survey: they move a lot, live in deep or vast oceans, hide, or few experts can identify them.
- A criterion must fit the data: if numbers are rising, 'declining' is wrong; say 'small population' or 'small range'.
Worked example (the chart above): amphibians: 16% CR + 14% EN + 11% VU = 41% threatened. Deep-sea squid are 60% data deficient: they move fast through a huge, dark ocean, so they are hard to find and count.
Give the reason, not just the problem: 'They are hard to find' or 'they migrate' alone is not enough. Say why: 'they migrate across whole oceans, so they cannot be counted in one place'.
Study smarter, not longer
Most students waste 40% of study time on topics they already know. Our AI tracks your progress and optimizes every minute.
How this comes up: Paper 1 or 2: a fact file or data on one species. List or identify IUCN criteria that explain its status [1-2].
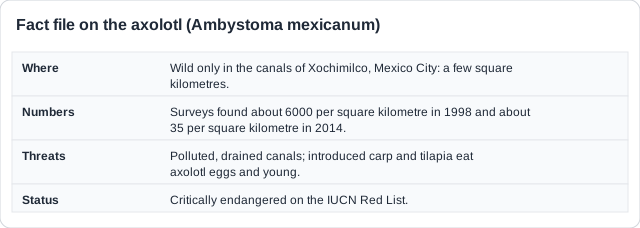
Figure 1 is a fact file on the axolotl, a salamander.
The IUCN uses criteria to classify a species as critically endangered. With reference to Figure 1, identify two criteria that the axolotl meets.
Model answer plan
See the mark-by-mark plan — for / against / judgement, with marking guidance — in study mode.