Primary and secondary pollutants at Higher Level: The same two kinds as SL, through different places: Italy's 2020 lockdown, Lagos's generators, Beijing's rising ozone and the Taj Mahal. At HL, notice when cutting a primary pollutant does not cut a secondary one, and why: this leads into photochemical smog.
Practise this as you read
- Trace each secondary pollutant back to the primary ones that form it.
- Explain a trend with reasons for both its rise and its fall.
Free preview
This is the free notes preview
You're reading the free notes. Aimnova Pro unlocks the full study experience — and you can try it with your first topic free to keep:
- FlashcardsLock in vocabulary and key terms with spaced repetition.
- Practice questionsAnswer exam-style questions and get instant AI marking.
- Mock exams & past-paper vaultSit full mocks and see exactly how examiners award marks.
- Personalised study planA daily plan built around your exam date and weak areas.
Directly or indirectly, it comes from burning: Most of the pollutants in city air come from combustion of fossil fuels, either straight from the fire or formed later in the air.
The points to remember
- Most urban air pollutants come from burning fossil fuels: coal, oil (petrol, diesel) and gas.
- Directly: released by the burning itself. These are primary pollutants.
- Indirectly: formed later in the air from what was released. These are secondary pollutants.
- So burning less fossil fuel cuts both kinds at once.
Remember it as: Primary from the pipe; secondary from the sky.
Real example: in March 2020 northern Italy locked down. Satellite maps showed the usual cloud of nitrogen dioxide over the Po Valley fading within weeks, as cars and factories stopped burning fuel.
Study smarter, not longer
Most students waste 40% of study time on topics they already know. Our AI tracks your progress and optimizes every minute.
Primary pollutants are the ones that leave the exhaust pipe or chimney already harmful. They do not need to change first. Among them are VOCs.
Primary pollutants
- A primary pollutant is active on emission: harmful as it leaves the exhaust or chimney.
- The guide's list: PM2.5, PM10, carbon monoxide and sulfur dioxide.
- NOₓ and VOCs are released directly too, and then help form secondary pollutants.
- VOCs evaporate from fuel, paints, solvents and industry.
- On a day's graph, primary pollutants peak at the rush hours, when most fuel is burned.
Particles
- PM2.5: fine soot and smoke
- PM10: dust and coarse soot
Gases
- Carbon monoxide (CO)
- Sulfur dioxide (SO₂)
Also released
- Nitrogen oxides (NOₓ)
- VOCs (hydrocarbons)
Real example: in Lagos, Nigeria, power cuts are so common that homes, shops and offices run diesel generators for hours a day. Each one releases carbon monoxide, NOₓ and PM2.5 directly into the street.
Secondary pollutants are never released. They form in the air when primary pollutants react with each other, with water or oxygen, often driven by sunlight.
Secondary pollutants
- A secondary pollutant is not released: it forms when primary pollutants react or change in the air.
- The guide's list: tropospheric ozone, nitric acid and sulfuric acid.
- Ozone: NOₓ + VOCs react in sunlight, so it peaks in the afternoon.
- Sulfuric acid: SO₂ + water + oxygen. Nitric acid: NOₓ + water + oxygen. Both fall as acid rain.
- Some particles are secondary too: sulfate and nitrate particles formed from SO₂ and NOₓ.
- Ozone near the ground (troposphere) is harmful; ozone high up (stratosphere) protects us from UV.
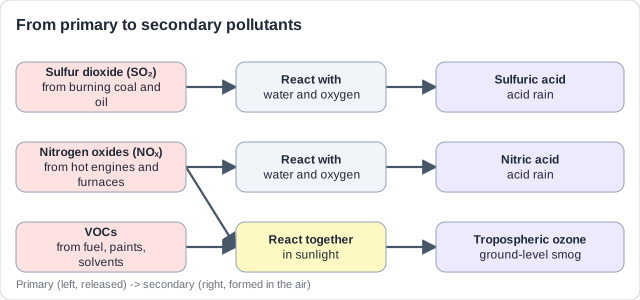
Real example: between 2013 and 2019 Beijing cut coal burning, and its PM2.5, a primary pollutant, fell sharply. Yet its summer ozone rose, because ozone is not released: it is made in the air from NOₓ and VOCs, which traffic still released.
Practice with exam-style questions
Answer exam-style questions and get AI feedback that shows you exactly what examiners want to see in a full-marks response.
A common question asks you to distinguish the two kinds. The marks go to two clear definitions and two examples that each tell their story.
Distinguishing them in an answer
- Define both: primary = active as released; secondary = formed from a primary pollutant by a chemical or physical change.
- Give a named example of each: without examples, the most you can get is half.
- A primary example needs its direct impact: 'CO from exhausts cuts the oxygen in the blood'.
- A secondary example needs the process: 'SO₂ reacts with water to form sulfuric acid'.
- NOₓ can be either: say whether it acts directly or forms something else.
- Eutrophication is not secondary air pollution; stratospheric ozone is the wrong layer.
Primary
- Released straight from the source
- Harmful as it is emitted
- PM2.5, PM10, CO, SO₂ (and NOₓ)
Secondary
- Formed later in the air
- Needs a reaction or change
- Ozone, nitric acid, sulfuric acid
Real example: in 1996 India's Supreme Court ordered coal-burning factories near the Taj Mahal to switch to gas or close. Their soot (primary) was staining the white marble, and their sulfur dioxide could form sulfuric acid (secondary) that eats it away.
A graph of one day's pollution shows the difference clearly: primary pollutants follow the traffic, and secondary ones follow the sun.
Reading a day of pollution
- Early morning: NO, NOₓ and hydrocarbons rise as rush-hour traffic burns fuel.
- Mid-morning: NO₂ rises as NO reacts with oxygen in the air.
- Afternoon: ozone peaks, because sunlight drives the reactions that form it.
- Evening: primary pollutants rise again with the second rush hour; ozone falls as the light fades.
- So the primary pollutant peaks first; the secondary one comes later.
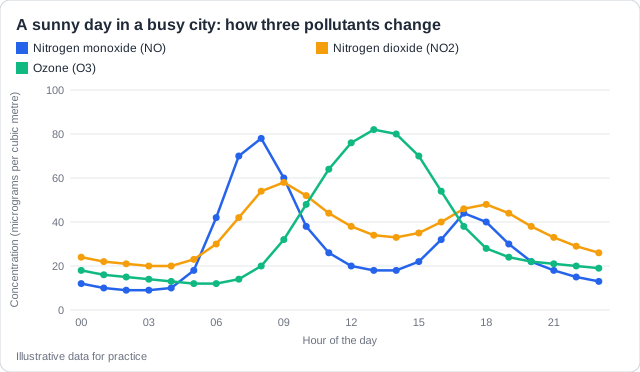
Real example: in Santiago, Chile, summer days follow the same pattern: NOₓ peaks with the morning traffic, and ozone reaches its highest levels in the afternoon sun.
Do not pick ozone: Asked to identify a primary pollutant from such a graph? Never choose ozone: it rises late because it is formed, not released.
Feeling unprepared for exams?
Get a clear study plan, practice with real questions, and know exactly where you stand before exam day. No more guessing.
Questions also show pollution changing over months or years and ask why. Almost every answer goes back to how much fossil fuel is burned, and when.
Why pollution levels change
- Winter PM2.5 peaks: more fuel burned for heating, more driving, less rain, inversions, cold engines, dry-season building work.
- Summer ozone peaks: more sunlight and heat speed up the reactions.
- Rising trends: more people, cars, industry and energy use as living standards rise; little political will.
- Rising ozone exposure: more NOₓ and VOCs, weak standards, livestock methane, hotter sunnier weather, tall buildings.
- Falling trends: catalytic converters, laws, cleaner fuels, campaigns, public transport.
- Sudden drops: when burning stops, as in the 2020 lockdowns.
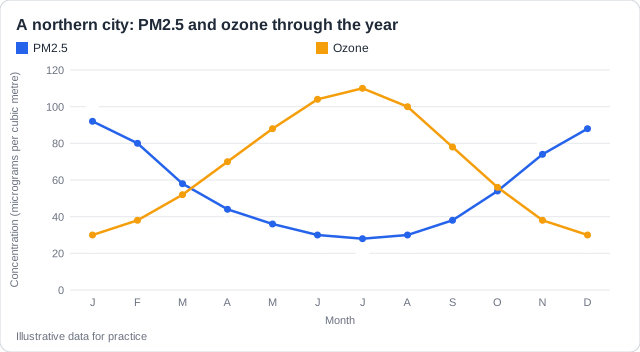
Real example: Krakow, Poland, banned burning coal and wood in home stoves from September 2019. Its winter PM levels, once among the worst in Europe, fell in the winters that followed.
Both sides of a trend: A graph that rises then falls needs reasons for the rise AND the fall: one side only loses a mark.
Link winter PM to burning: 'more coal burned for heat', not just 'people need heat'; electric heaters do not count. Ozone is not linked to CFCs or greenhouse gases.
How this comes up: Paper 2, Section A: a graph of a pollutant rising then falling, then 'Suggest possible reasons' [4]: reasons for both the rise and the fall.
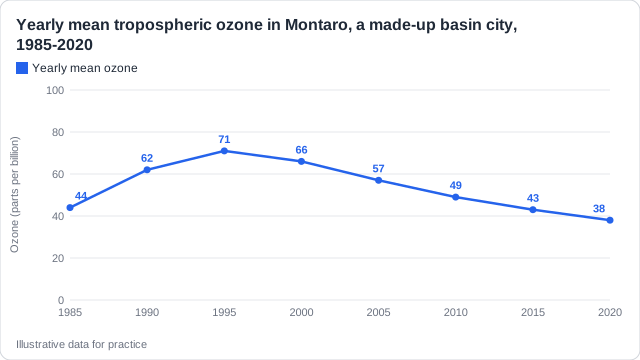
Montaro is a fast-growing city in a basin. Figure 1 shows its yearly mean tropospheric ozone.
Suggest possible reasons for the overall trend of tropospheric ozone shown in Figure 1.
Model answer plan
See the mark-by-mark plan — for / against / judgement, with marking guidance — in study mode.