Sources of pollutants at Higher Level: The same sources as SL, through different places: Popocatépetl and Mexico City, Australia's Black Summer, the 2015 Indonesian haze and Hong Kong's street canyons. At HL, ask who controls each source, and whether one city or country can manage it alone.
Practise this as you read
- Sort each source: natural or anthropogenic, local or from far away.
- Ask who could manage it: a city, a country, or several countries together.
Free preview
This is the free notes preview
You're reading the free notes. Aimnova Pro unlocks the full study experience — and you can try it with your first topic free to keep:
- FlashcardsLock in vocabulary and key terms with spaced repetition.
- Practice questionsAnswer exam-style questions and get instant AI marking.
- Mock exams & past-paper vaultSit full mocks and see exactly how examiners award marks.
- Personalised study planA daily plan built around your exam date and weak areas.
Released ready to do harm: A primary pollutant does harm in the form in which it is released. It can come from nature or from people: an anthropogenic source.
The points to remember
- A primary pollutant is active as soon as it is released, at the point of emission.
- Its sources can be natural (no people involved) or anthropogenic (caused by people).
- Natural: forest fires, dust blown off dry land, volcanic eruptions.
- Anthropogenic: burning fossil fuels and biomass for energy, burning to clear land, dust from building sites and roads.
- Many pollutants have both: PM from dust storms and building sites; NOₓ from lightning and engines.
Natural sources
- Forest fires
- Dust from deserts and dry land
- Volcanic eruptions
Anthropogenic sources
- Burning fossil fuels and biomass
- Burning to clear farms and forests
- Dust from building sites and roads
Real example: Mexico City gets both kinds. The volcano Popocatépetl sometimes rains ash on the city (natural); in May 2023 the ash closed its airport for hours. Every day, millions of vehicles add NOₓ and soot (anthropogenic).
Study smarter, not longer
Most students waste 40% of study time on topics they already know. Our AI tracks your progress and optimizes every minute.
Natural sources are outside human control. They come and go as events, but a big fire, dust storm or eruption can swamp a city's air for days.
Natural sources
- Forest fires (wildfires): smoke full of PM2.5, plus carbon monoxide and NOₓ.
- Dust: wind lifts soil from deserts and dry, bare land: PM10.
- Volcanic eruptions: ash (PM) and sulfur dioxide.
- Also natural: lightning and soil microbes make NOₓ; plants release pollen; sea spray adds salt particles.
- Natural sources are usually short events, but they can be huge and travel far.
Remember it as: Fire, dust, volcano: nature's three big sources.
Real example: during Australia's Black Summer, smoke from forest fires poured into Canberra. On 1 January 2020 its air quality index passed 7,000, where 200 already counts as 'hazardous': the worst of any city in the world that day.
Fit the source to the place: Only give a natural source the place could really have. On an island with no volcanoes, 'volcanic ash' scores nothing.
Most city air pollution is anthropogenic, and nearly all of it comes from burning something: fuel, wood, crop waste or rubbish.
Anthropogenic sources, by sector
- Transport, the largest source in most cities: NOₓ, CO, PM and VOCs from petrol and diesel exhausts and ships.
- Power stations and industry (cement kilns, oil refineries, fertiliser works): SO₂, NOₓ, PM, heavy metals.
- Homes: burning wood, coal, charcoal or dung (biomass) to heat and cook: PM and CO.
- Burning to clear land: farmers burn crop stubble; forest is burned to make farmland.
- Building sites and roads: dust (PM10); also tyre and brake wear.
- Burning waste: rubbish fires and incinerators: PM and NOₓ.
Burning for energy
- Petrol and diesel in vehicles
- Coal and gas in power stations
- Wood and charcoal in homes
Burning to clear land
- Crop stubble after harvest
- Forest burned for farmland
- Rubbish fires
Dust
- Building and demolition
- Unpaved and busy roads
- Quarries and cement works
Reading a radar diagram: Some papers show which process or life-cycle stage causes most of each impact on a radar diagram. Find the axis for the impact asked about, then the outline that reaches furthest along it. In farming, burning biomass is often the biggest source of smoke.
Real example: in 2015, fires were set across Indonesia to clear peat land for oil palm and paper plantations. The haze covered Indonesia, Singapore and Malaysia for weeks and schools closed; one study estimated about 100,000 early deaths.
Say what is burned or released: 'Cars' or 'industry' alone is not a source. Say the activity: 'burning diesel in buses', 'dust from building sites', 'smoke from burning crop stubble'. A gas such as CO₂ is not particulate matter.
Practice with exam-style questions
Answer exam-style questions and get AI feedback that shows you exactly what examiners want to see in a full-marks response.
Maps of city air show the same pattern again and again: pollution from traffic is worst in the centre and fades towards the suburbs.
Why the centre is worst
- The most traffic is in the centre, and burning fuel in engines releases NOₓ.
- Buses, taxis and delivery lorries, often diesel, crowd the central streets.
- Congestion: stop-start engines and queues release more NOₓ per kilometre.
- Tall buildings trap polluted air: little wind gets into the narrow streets.
- Few trees or parks in the centre to take up pollutants and clean the air.
- If the city's power station is far outside it, do not blame factories in the centre.
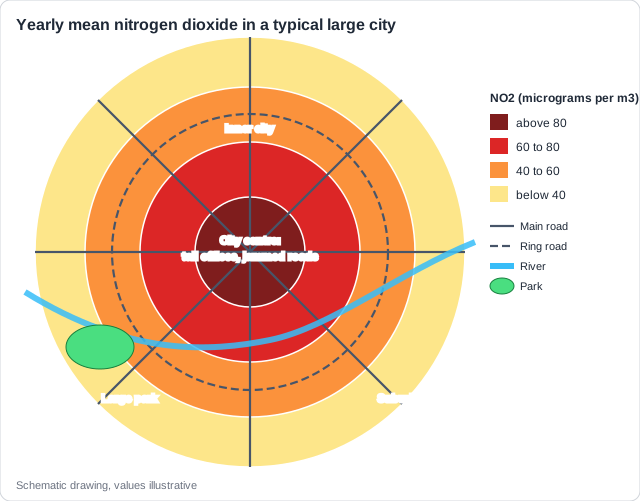
Real example: in Hong Kong's business districts, roadside monitors in narrow streets between tower blocks record much higher NO₂ than monitors in open areas. The towers make street canyons, so exhaust from buses and taxis is trapped.
Air moves, so a city can breathe pollution made far away, by people or by nature, in another region or another country.
Pollution on the wind
- Pollution does not stop at borders: the wind carries it from its source.
- Smoke from fires, desert dust and power-station gases can travel hundreds of kilometres.
- So a city's air can be polluted by activities in another region or country.
- In an answer, give two steps: the source outside, then the prevailing wind that brings it in.
Source
- Strong winds lift dust off the Sahara Desert in March 2022.
Wind
- A southerly airflow carries the dust north across the Mediterranean.
City
- Madrid's sky turns orange and PM10 rises far above safe levels.
Two marks, two steps: Asked how activities outside a country add to a city's PM2.5? Name the source over the border (crop burning, coal power, fires, dust), then say the prevailing wind carries it in.
Feeling unprepared for exams?
Get a clear study plan, practice with real questions, and know exactly where you stand before exam day. No more guessing.
You can plan a simple experiment that uses living things to show pollution. An indicator species does the measuring for you. Lichens are the classic choice.
Planning a lichen survey
- An indicator species shows pollution by whether it is present, absent or how much there is.
- Lichens grow on tree bark and take everything from the air, so polluted air kills sensitive ones.
- Shrubby lichens need clean air; leafy ones cope with some pollution; flat crusty ones cope with most.
- Plan: trees of the same species at set distances from a busy road; record lichens at the same height and on the same side of each trunk.
- Repeat on several trees per site; measure NO₂ too if you can (e.g. diffusion tubes).
- Plot distance against number of lichen species and test the correlation.
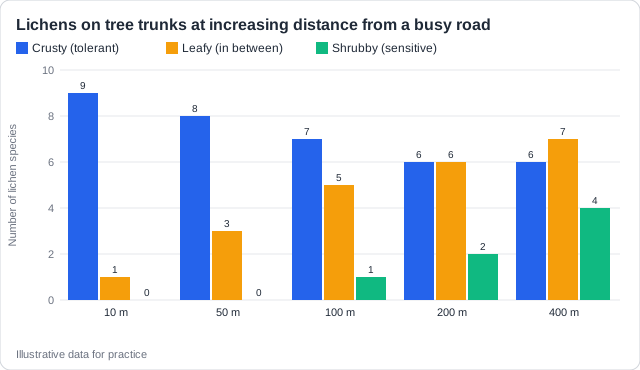
Real example: the bright orange lichen Xanthoria parietina thrives on trees beside busy roads and farms, because it likes the extra nitrogen from traffic and fertilisers. Where it takes over and sensitive lichens vanish, nitrogen pollution is high.
A correlation, not a cause: Fewer lichens near the road correlates with pollution, but shade, bark type or tree age could also matter. Keep those the same, and measure the pollution directly to check.
How this comes up: Paper 1: a map of pollution across a city, then 'Explain' [3]: three separate causes, each linked to the map.
Figure 1 shows the yearly mean nitrogen dioxide (NO2) across a large city. The city's electricity is generated 60 km away.
With reference to Figure 1, explain why the highest levels of NO2 are found in the centre of the city.
Model answer plan
See the mark-by-mark plan — for / against / judgement, with marking guidance — in study mode.