Population and Earth systems at Higher Level: This statement is Higher Level only. It links rapid population growth to stress on Earth's systems, using UN projections for the next 50 and 100 years, the unequal spread of biocapacity, and the doughnut economics model.
Practise this as you read
- Describe the impacts of a short doubling time on a population and its environment.
- Outline the factors that change population projections.
- Explain stress on Earth's systems using biocapacity and the doughnut model.
Free preview
This is the free notes preview
You're reading the free notes. Aimnova Pro unlocks the full study experience — and you can try it with your first topic free to keep:
- FlashcardsLock in vocabulary and key terms with spaced repetition.
- Practice questionsAnswer exam-style questions and get instant AI marking.
- Mock exams & past-paper vaultSit full mocks and see exactly how examiners award marks.
- Personalised study planA daily plan built around your exam date and weak areas.
More people, more pressure: Every person needs food, water, energy and a home. As the population grows quickly, total demand on Earth systems grows too.
The points to remember
- More people need more food, water, energy, housing and materials.
- Total demand = population × use per person, so growth raises the ecological footprint.
- Farmland spreads: deforestation, natural capital used up, biodiversity lost.
- More energy use means more carbon emissions and climate change.
- More waste and pollution: air, water and land.
- Demand can exceed biocapacity or carrying capacity.
Growth
- Nigeria grew from 97 million people in 1990 to 233 million in 2024
Food and land
- More farmland is cleared for food and fuelwood, so forests and other natural capital shrink
Water and waste
- Fast-growing cities such as Lagos struggle to supply clean water and collect rubbish
Footprint
- Even with a small ecological footprint per person, the total footprint grows with every extra person
Learn what examiners really want
See exactly what to write to score full marks. Our AI shows you model answers and the key phrases examiners look for.
How fast a population grows matters as much as its size. The doubling time shows how little time there is to build schools, homes and farms.
A short doubling time
- Doubling time ≈ 70 ÷ growth rate (%).
- A short doubling time means rapid growth: services must double within one generation.
- Population effects: pressure on health care, schools, jobs and housing; disease spreads.
- This can mean low income, unemployment and a low quality of life.
- Environment effects: deforestation, water demand, energy and emissions, waste, biodiversity loss.
Formula
Doubling time ≈ 70 ÷ growth rate (%).
Natural increase
Nigeria, 2024: 32.5 births - 11.6 deaths = 20.9 per 1000 = 2.09%.
Divide
70 ÷ 2.09 = about 33 years.
Meaning
By about 2057, twice as many homes, school places and meals would be needed.
Describe impacts on both: When a question asks about the population and the environment, give at least one effect on each. A list of only environmental damage misses the effects on people.
The UN updates its projections every two or three years. Each projection variant rests on a different guess about future fertility.
Projections for 50 and 100 years
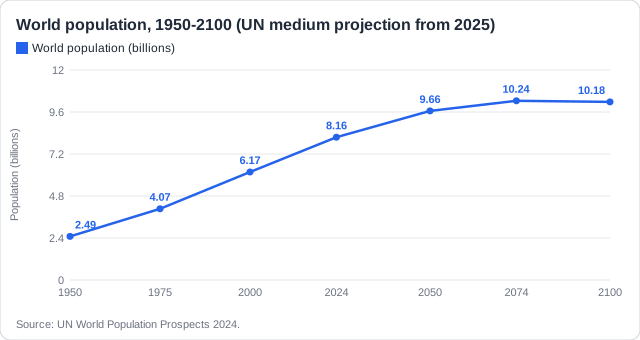
- 2024: about 8.2 billion people.
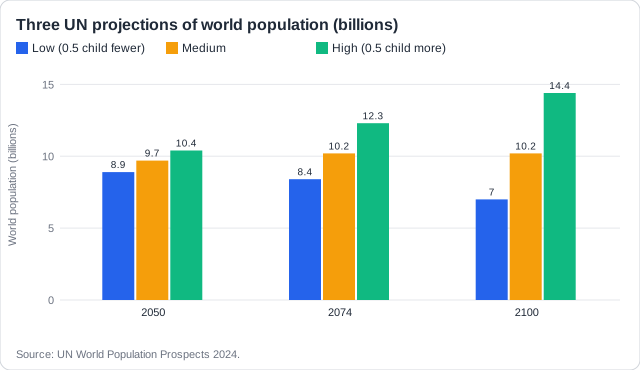
- In 50 years (2074): about 10.2 billion (UN medium projection).
- Peak of about 10.3 billion in the mid-2080s, then a slow fall to 10.2 billion by 2100.
- Low and high versions differ by half a child per woman: 7.0 or 14.4 billion in 2100.
- Projections change with fertility, mortality, migration and their assumptions.
Real example: in 2019 the UN projected about 10.9 billion people for 2100. By 2024 the projection had fallen to 10.2 billion, because birth rates fell faster than expected in countries such as China.
Never wonder what to study next
Get a personalized daily plan based on your exam date, progress, and weak areas. We'll tell you exactly what to review each day.
Projections are models, so they change when the things they assume change.
What can change a projection
- Fertility: education of girls, access to contraception, the status of women, policies.
- Mortality: health care, life expectancy, pandemics, famine, war.
- Migration: changes a country's projection, not the world total.
- Momentum: young age structures keep growth going for decades.
- New data: the UN updates its forecast every two or three years.
Lower
- More girls finish school and marry later
- Cheap, easy family planning
- Fertility falls faster, as in South Korea
Higher
- Fertility falls more slowly, as in Niger and Nigeria
- People live longer
- Health care cuts deaths of babies
Uncertain
- Pandemics, famine and war
- Climate change
- Government population policies
Remember it as: Fertility drives the forecast; half a child is 7 billion people.
Nature's supply is its biocapacity; our demand is the ecological footprint. Both are measured in global hectares.
Biocapacity disparity
- World biocapacity: about 1.5 global hectares per person.
- World ecological footprint: about 2.6 global hectares per person.
- So humanity uses nature about 1.8 times faster than it regrows.
- Biocapacity disparity: footprints and biocapacity are spread very unequally.
- Rich countries use far more than their share; many poorer, fast-growing ones use less.
| Country | Country Overshoot Day 2026 | If everyone lived like this |
|---|---|---|
| Qatar | 4 February | About 10 Earths would be needed |
| United States | 14 March | About 5 Earths |
| Japan | 14 May | About 2.7 Earths |
| India, Nigeria | None | Less than 1 Earth: footprint per person below world biocapacity per person |
Real example: Earth Overshoot Day fell on 24 July in 2025, the earliest date yet. Growth in population and in consumption both push it earlier: Nigeria's footprint per person is small, but its population may grow by about 140 million by 2054.
Stop wasting time on topics you know
Our AI identifies your weak areas and focuses your study time where it matters. No more overstudying easy topics.
Meeting needs without breaking the planet: Kate Raworth's doughnut shows the goal: lift everyone above the social foundation without pushing Earth past its planetary boundaries.
The doughnut economics model
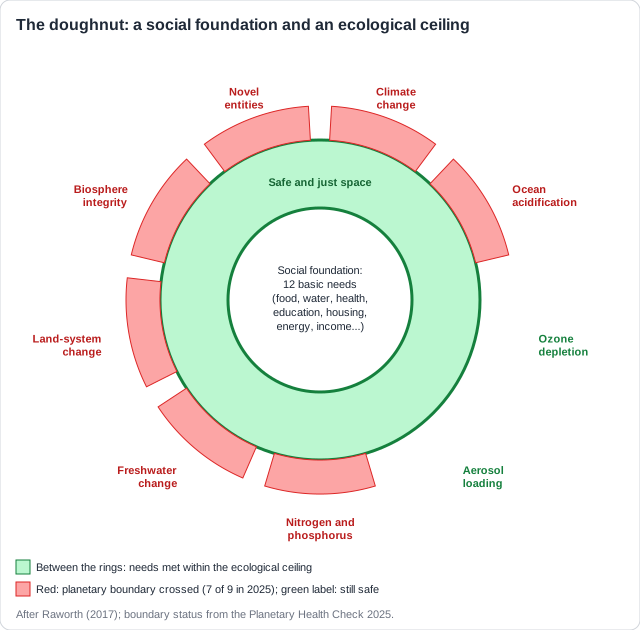
- Doughnut economics (Kate Raworth): a safe and just space between two rings.
- Inner ring: the social foundation, 12 basic needs everyone should have.
- Outer ring: the ecological ceiling, the nine planetary boundaries.
- Shortfall: people below the foundation. Overshoot: pressure beyond the ceiling.
- Population growth adds to both: more needs to meet, more pressure on the ceiling.
- In 2025, 7 of the 9 planetary boundaries had been crossed.
Ceiling: overshoot
- Planetary Health Check, September 2025: 7 of 9 boundaries crossed
- Ocean acidification crossed for the first time
- Only ozone and aerosols still safe
Foundation: shortfall
- A 2022 study of about 140 countries (Fanning and others)
- No country met its people's basic needs within its fair share of the boundaries
- Amsterdam adopted the doughnut as city policy in April 2020
How this comes up: Paper 2: describe the impacts of a short doubling time on a population and its environment [3]. Essays may ask how far population growth, rather than consumption, stresses Earth's systems.
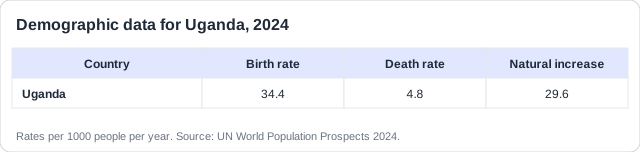
In 2024 Uganda had a crude birth rate of 34.4 and a crude death rate of 4.8 per 1000 people, giving a doubling time of about 24 years.
Describe the impacts of Uganda's doubling time on its population and environment.
Model answer plan
See the mark-by-mark plan — for / against / judgement, with marking guidance — in study mode.