Rising energy demand at Higher Level: The same ideas as SL, with different examples: India's electricity, the world's air conditioners, China's steel, and the gap between the United States and Ethiopia. At HL, rising demand drives energy security and the depletion of fossil fuels, which come later in 7.2.
Practise this as you read
- Explain why demand rises: population and per capita demand.
- Calculate % and average change.
Free preview
This is the free notes preview
You're reading the free notes. Aimnova Pro unlocks the full study experience — and you can try it with your first topic free to keep:
- FlashcardsLock in vocabulary and key terms with spaced repetition.
- Practice questionsAnswer exam-style questions and get instant AI marking.
- Mock exams & past-paper vaultSit full mocks and see exactly how examiners award marks.
- Personalised study planA daily plan built around your exam date and weak areas.
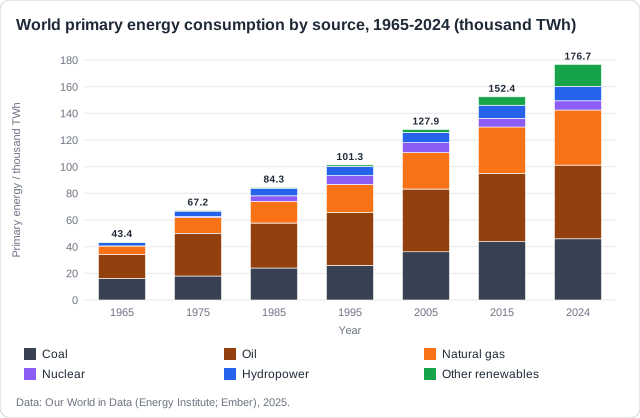
More energy every decade: The world uses more energy almost every year. Primary energy use has grown about four times since 1965.
The points to remember
- World energy use is rising: about 4 times as much in 2024 as in 1965.
- 2024 set a new record: use grew about 2%, and every source grew, coal included.
- Most energy still comes from fossil fuels: about 81% in 2024 (94% in 1965).
- Renewables are increasing fast, but so far they add to fossil fuels rather than replace them.
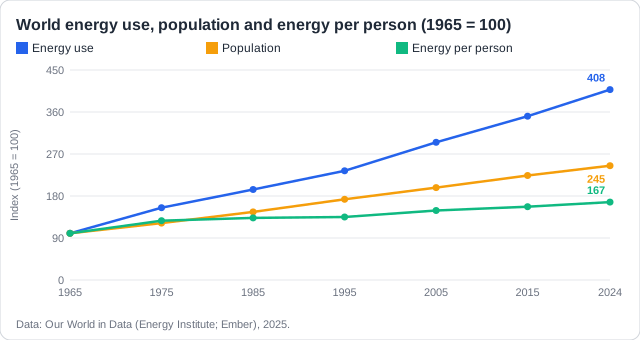
- Two drivers: more people and more energy per person (per capita demand).
Real example: India's electricity generation more than doubled between 2010 (936 TWh) and 2024 (2,037 TWh), as millions of homes were connected and factories grew.
Know your predicted grade
Take timed mock exams and get detailed feedback on every answer. See exactly where you're losing marks.
Energy use grows for two reasons: there are more people, and each person uses more. Since 1965 energy use has grown faster than population, so use per capita has risen too.
The points to remember
- Population growth: 3.3 billion people in 1965, 8.2 billion in 2024; each needs energy.
- Higher standard of living: more appliances, cars, flights and air conditioning.
- Industrial development: factories, mines and cities use far more energy than farming.
- Urbanisation and access to electricity: newly connected homes start using power.
- Use per person can fall: recession, efficiency, heavy industry closing.
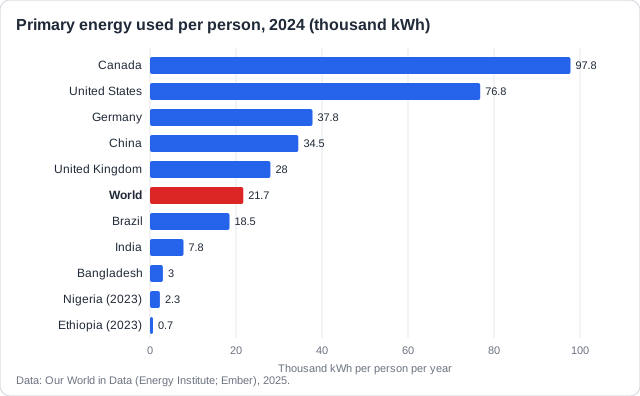
- A US citizen uses about 10 times as much energy as someone in India.
Remember it as: More people, more each: that is why demand rises.
Real example: the IEA expects the world's air conditioners to rise from about 1.6 billion to 5.6 billion by 2050, mostly in hot, fast-growing countries such as India and Indonesia.
Even as renewables grow, the world still depends on fossil fuels. Some industries cannot yet run without them, and many countries choose the fuels they already have.
The points to remember
- Fossil fuels are available, cheap and reliable, and the infrastructure (power stations, cars, pipelines) already exists.
- Steel is made with coal (coke) in blast furnaces.
- Concrete: cement kilns burn fossil fuels at about 1,450°C.
- Synthetic fertiliser: ammonia is made from natural gas.
- Countries seeking economic growth and energy security use the fuels they have: China's coal, US shale gas from fracking.
Steel
- Coal is baked into coke
- Coke removes oxygen from iron ore
Concrete
- Cement kilns burn coal or gas
- Heating limestone releases CO₂
Fertiliser
- Ammonia is made from natural gas
- It feeds about half the world's people
Rising, despite greener values: Support for ecocentric values is growing, through the media, climate disasters, NGOs and education. Yet governments often put cheap, reliable energy and economic growth first, so fossil fuel use keeps rising.
Real example: China makes more than half of the world's steel, most of it in blast furnaces fuelled by coal coke, so its coal use stays high even as it builds record amounts of solar power.
Get feedback like a real examiner
Submit your answers and get instant feedback — what you did well, what's missing, and exactly what to write to score full marks.
There are two ways to meet growing demand, and they work best together: produce energy differently, and use less of it.
The points to remember
- Meet demand by changing production: more renewables and nuclear in place of fossil fuels.
- Meet demand by reducing consumption: energy conservation and efficiency (7.2.6).
- Use is unequal: Canada about 98,000 kWh per person, Ethiopia about 700 (2023).
- About 685 million people still had no electricity in 2022, most in sub-Saharan Africa.
- Fairer use means rich countries using less and poor countries using more, cleanly.
Change production
- Build wind, solar and hydropower
- Replace coal with lower-carbon sources
- Store renewable energy (7.2.5)
Reduce consumption
- Turn off, turn down, travel less
- Efficient lights, homes and vehicles
- Waste less in industry (7.2.6)
Can energy use be equitable?: Rich countries use many times more energy per person than poor ones. A fair future means the richest cut waste, while the poorest gain the energy they need for health and work.
Real example: an average person in the United States uses about 76,800 kWh of energy a year; in Ethiopia it is about 700 kWh, more than 100 times less.
Papers give energy data over time and ask how much it rose, or what the trend is. Learn the two formulas and how to describe a trend.
Calculating and describing change
- % increase = (new − old) ÷ old × 100.
- Average annual increase = (last value − first value) ÷ number of years.
- Count the years between the dates: 2008 to 2019 is 11 years, not 12.
- Show the working, then the answer with its unit; do not round too early (5.2%, not 5%).
- A trend needs dates and values: 'rose from 51 TWh in 2017 to 83 TWh in 2022'.
Worked example: World primary energy: 152,400 TWh in 2015, 176,700 TWh in 2024. % increase = (176,700 − 152,400) ÷ 152,400 × 100 = 15.9%. Average annual increase = 24,300 ÷ 9 years = 2,700 TWh per year.
Difference
New minus old: the rise.
Divide
By the OLD value for %, by the years for a yearly average.
Unit
% or TWh per year; keep one decimal place.
Three slips: Dividing by the new value. Counting the years wrongly (2008 to 2019 is 11). Describing a trend with no dates or values.
Learn what examiners really want
See exactly what to write to score full marks. Our AI shows you model answers and the key phrases examiners look for.
How this comes up: Paper 1 and Paper 2 (specimen; May 2023; May 2025; May 2026): energy data over time, then a calculation [1-2] and reasons for rising demand [2].
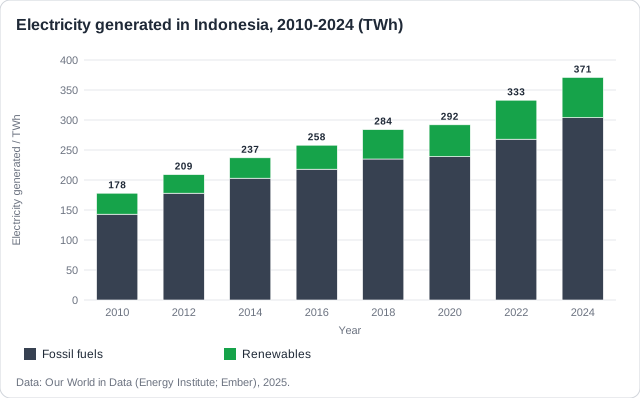
The figure shows the electricity generated in Indonesia between 2010 and 2024.
(a) Calculate the percentage increase in electricity generated between 2014 and 2024.
(b) Suggest two reasons why electricity generation in Indonesia has increased.
Model answer plan
See the mark-by-mark plan — for / against / judgement, with marking guidance — in study mode.