The ozone planetary boundary at Higher Level: The same conclusion as SL, read through different evidence: the first boundary study of 2009, the split vortex of 2002, the fall in stratospheric chlorine, and how economic policy can help ozone recover.
Practise this as you read
- Describe an ozone record with years and numbers, and spot the odd years.
- Link economic and social policies to ozone, not to climate in general.
Free preview
This is the free notes preview
You're reading the free notes. Aimnova Pro unlocks the full study experience — and you can try it with your first topic free to keep:
- FlashcardsLock in vocabulary and key terms with spaced repetition.
- Practice questionsAnswer exam-style questions and get instant AI marking.
- Mock exams & past-paper vaultSit full mocks and see exactly how examiners award marks.
- Personalised study planA daily plan built around your exam date and weak areas.
A boundary that held: planetary boundaries are limits that keep the Earth in a safe state. For ozone, the limit is a small loss of the ozone layer. Thanks to the Montreal Protocol, the world has stayed inside it.
The points to remember
- Planetary boundaries mark a safe operating space for humanity; ozone depletion is one of nine.
- The ozone boundary is less than 5% below the pre-industrial level of 290 DU: about 276 DU.
- The global average was 284.6 DU in 2023: the boundary has not been crossed.
- The Antarctic hole dips far lower each spring, but that is regional and seasonal; the global average is safe.
- The reason: actions under the Montreal Protocol cut ODSs before ozone fell further.
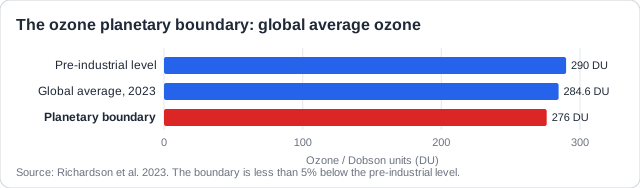
Real example: in the first planetary boundaries study (Rockström and colleagues, 2009), global ozone was 283 Dobson units (DU). By 2023 it was 284.6 DU: one of the very few boundaries moving back towards safety, not away from it.
Stop wasting time on topics you know
Our AI identifies your weak areas and focuses your study time where it matters. No more overstudying easy topics.
Papers give a graph of the ozone hole over time and ask you to describe it, or to read off a year. Learn the shape of the real record.
The points to remember
- Describe the direction, the years and the numbers: 'rose from 0.1 in 1979 to 23.6 million km² in 1994'.
- 1979 to the late 1980s: a rapid increase in the hole's area.
- 1990s to about 2006: large and fairly stable, peaking at 26.6 million km² in 2006.
- Since about 2000: fluctuating, with a slight overall decrease; very small in 2002 and 2019.
- Do not describe the projected part of a graph when asked about the recorded data.
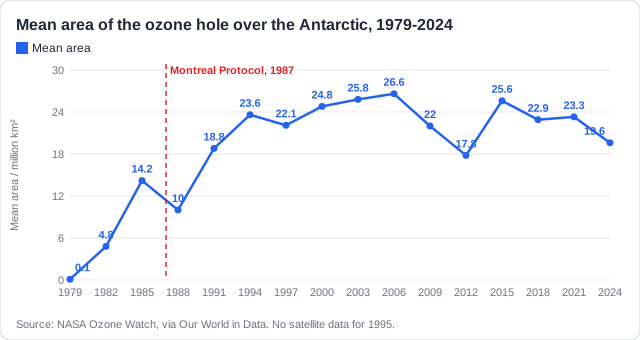
Remember it as: Up fast, flat at the top, slowly down.
Real example: in 2002 the polar vortex split in two, and the hole's mean area fell to 12.0 million km², from 25.0 the year before. Single odd years like 2002 and 2019 are weather, so describe the trend over decades.
Did the Protocol work? Read the data: The guide asks you to use data on the ozone hole over time as evidence. Compare before and after 1987, and be honest about what the data do not yet show.
The points to remember
- The Protocol was signed in 1987: compare the data before and after.
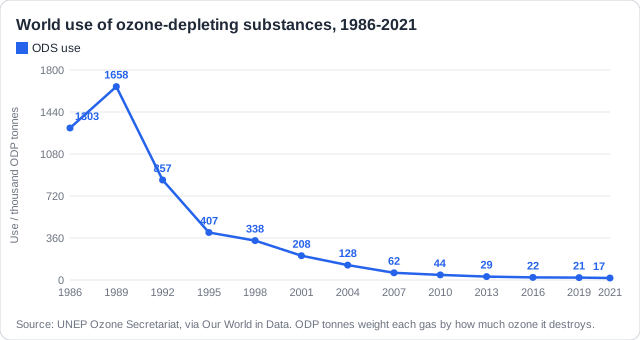
- World ODS use fell by about 99%, from 1.66 million ODP tonnes (1989) to 17 thousand (2021).
- Chlorine in the stratosphere peaked in 1993 and has fallen since.
- The hole stopped growing in the late 1990s and has slowly begun to shrink: some success.
- But it has not returned to 1980 levels: long-lived ODSs (and a black market) cause a time lag.
- So the data support success, but the final judgement must wait for recovery.
Real example: total chlorine entering the stratosphere peaked in 1993 at about 3,660 ppt. By 2020 it was 3,240 ppt, 11.5% lower (WMO/UNEP, 2022). Ozone follows the chlorine, but years later.
Both sides: Say what supports success (the hole stopped growing) and what limits the judgement (no full recovery yet; a black market; long-lived ODSs).
See how examiners mark answers
Answer exam-style questions with model answers. Learn exactly what earns marks and what doesn't.
Scientists use models to project when ozone will recover, and to imagine the world without the Protocol. Both support the conclusion that the boundary was protected.
The points to remember
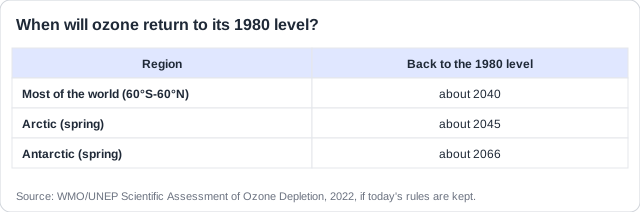
- Ozone should return to 1980 levels around 2040 for most of the world, 2045 in the Arctic, 2066 in the Antarctic.
- Why it recovers: CFCs banned, alternatives used, refrigerants recycled.
- Education changed what people buy, and international cooperation continues.
- Ozone re-forms naturally as the old ODSs slowly break down: the balance tips back.
- Projections are uncertain: models simplify, behaviour and illegal ODSs are hard to predict.
Real example: the Sustainable Development Goals (SDGs) include SDG 8, decent work, which can also protect ozone. India's Cooling Action Plan (2019) planned to train and certify 100,000 technicians who service fridges and air conditioners, so that coolant gases are recovered instead of leaking.
Reasons for the projected recovery: Two reasons, each a full sentence: what was done (the ban, alternatives, recycling, education) and why ozone comes back (ODSs break down, so ozone re-forms).
How this comes up: Paper 2, Section A: describe the ozone hole from 1979 [2], read the year it was largest [1], and discuss how a Sustainable Development Goal could help ozone recover [4].
India is one of the world's fastest-growing markets for air conditioners, and most of its fridges and air conditioners are repaired by small local businesses.
Discuss how efforts to promote Sustainable Development Goal 8 (decent work and economic growth) could contribute to the recovery of the ozone layer.
Model answer plan
See the mark-by-mark plan — for / against / judgement, with marking guidance — in study mode.