Climate scenarios at Higher Level: This statement is Higher Level only. It is about how climate models are run with different scenarios of future emissions, and how to read the predicted impacts: global temperature, sea level rise, local temperature and rain.
Practise this as you read
- Read a scenario chart: quote the lowest and highest values with units.
- Explain why the impacts differ between scenarios.
Free preview
This is the free notes preview
You're reading the free notes. Aimnova Pro unlocks the full study experience — and you can try it with your first topic free to keep:
- FlashcardsLock in vocabulary and key terms with spaced repetition.
- Practice questionsAnswer exam-style questions and get instant AI marking.
- Mock exams & past-paper vaultSit full mocks and see exactly how examiners award marks.
- Personalised study planA daily plan built around your exam date and weak areas.
Not one future, but several: Nobody knows how much fossil fuel the world will burn. So climate models are run with several scenarios, from very low to very high emissions, and the IPCC compares the results.
What a scenario is: the points to remember
- A scenario is a possible future: how population, economies, technology and policy may change.
- Each scenario gives a different path of greenhouse gas emissions.
- The same models are run with each scenario as the input.
- So the outputs show a range of possible impacts, from low to high emissions.
- Scenarios are not forecasts: nobody says which one will happen; that depends on our choices.
| Scenario | The story | Emissions |
|---|---|---|
| SSP1-1.9 / SSP1-2.6 | sustainability: clean energy, cooperation | net zero around or after 2050 |
| SSP2-4.5 | middle of the road: today's trends continue | about today's level until 2050 |
| SSP3-7.0 | regional rivalry: countries go their own way | rise to about double by 2100 |
| SSP5-8.5 | fossil-fuelled growth | about double by 2050 |
Real example: read a name like SSP2-4.5 in two halves. The first part, SSP2, is the story: middle of the road. The second, 4.5, is the extra heating by 2100 in watts per square metre, the same number used by the older RCPs (RCP4.5). The IPCC's 2021 report uses the SSPs.
Study smarter, not longer
Most students waste 40% of study time on topics they already know. Our AI tracks your progress and optimizes every minute.
The first output everyone looks at is global temperature. The difference between the scenarios is the difference our choices make. Very low emissions need net zero carbon dioxide around 2050.
Temperature under each scenario: the points to remember
- Every scenario warms the world; how much depends on emissions.
- Very low emissions (SSP1-1.9): about 1.4 °C by 2081-2100; very high (SSP5-8.5): about 4.4 °C.
- Only the very low scenario keeps warming near 1.5 °C; it needs net zero CO2 around 2050.
- Each scenario has a range (the bar), because the models differ.
- Today's policies point to about 2.7 °C: close to the middle scenario, SSP2-4.5.
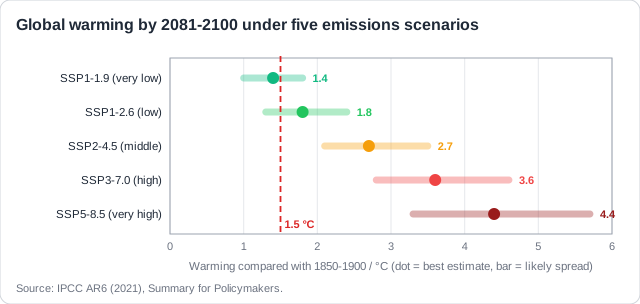
Remember it as: Low road 1.4, middle road 2.7, high road 4.4.
Real example: the Climate Action Tracker adds up what governments' current policies would do. It points to about 2.7 °C of warming by 2100: close to the middle scenario, SSP2-4.5, and far from the 1.5 °C goal of the Paris Agreement.
Sea level rise is the impact coastal cities plan for. It rises in every scenario, but the higher the emissions, the faster and further it goes.
Sea level under each scenario: the points to remember
- Sea level rises in every scenario: warmer water expands and ice on land melts.
- By 2100: about 0.38 m (very low emissions) to about 0.77 m (very high).
- It keeps rising for centuries, even after emissions stop: oceans and ice sheets respond slowly.
- If ice sheets break up fast, a rise of up to 2 m by 2100 cannot be ruled out.
- Planners use the scenarios to decide how high and how soon to build defences.
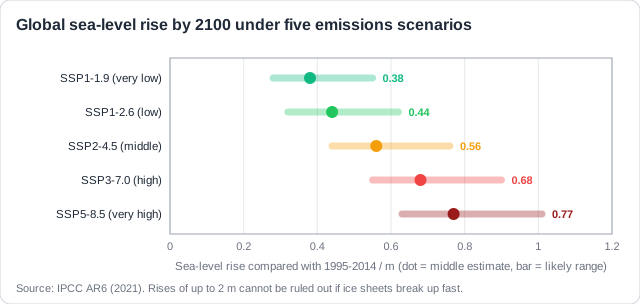
Real example: the Thames Barrier, a flood barrier that protects London, was planned with sea level scenarios. The Thames Estuary 2100 plan expects it to protect London until about 2070. By about 2050 a decision is due on what replaces it, based on which scenario the world is following.
Practice with exam-style questions
Answer exam-style questions and get AI feedback that shows you exactly what examiners want to see in a full-marks response.
People live in places, not in global averages. Models also give local temperature and precipitation, scenario by scenario, so farmers, cities and water companies can plan.
Local temperature and rain: the points to remember
- Global averages hide local differences: models also give local temperature and rainfall.
- Land warms faster than the ocean; the Arctic warms fastest, nearly four times the world rate.
- Wet places and seasons tend to get wetter; many dry places (the Mediterranean) get drier.
- Heavy rain and heatwaves become more frequent and more intense in most places.
- The higher the emissions scenario, the bigger every local change.
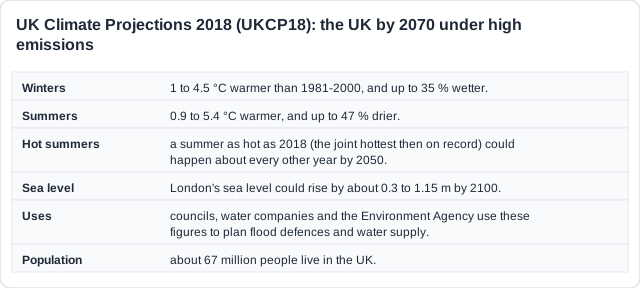
UK winters by 2070
- 1 to 4.5 °C warmer
- Up to 35 % wetter
- More winter floods
UK summers by 2070
- 0.9 to 5.4 °C warmer
- Up to 47 % drier
- More heatwaves, droughts
Describe a scenario chart: Quote the lowest and highest values with units, say that every scenario shows a change, and say that the spread widens with higher emissions.
How this comes up: Paper 2, Section A: a chart or table of scenarios (temperature, sea level, rainfall) to read, compare and explain. Section B: explain how scenarios are used to predict impacts, with named examples.
The IPCC projects that global sea level will rise by about 0.38 m by 2100 under a very low-emissions scenario (SSP1-1.9) and by about 0.77 m under a very high-emissions scenario (SSP5-8.5).
Explain why the projected sea level rise differs between the scenarios, and why it rises even in the lowest one.
Model answer plan
See the mark-by-mark plan — for / against / judgement, with marking guidance — in study mode.