Global climate models at Higher Level: This statement is Higher Level only. It explains how a climate model turns inputs into predictions, how it is tested by hindcasting, and why its answers come as a range.
Practise this as you read
- Outline a model as inputs, equations and outputs, with a real example.
- Explain how uncertain inputs lead to a range of outcomes.
Free preview
This is the free notes preview
You're reading the free notes. Aimnova Pro unlocks the full study experience — and you can try it with your first topic free to keep:
- FlashcardsLock in vocabulary and key terms with spaced repetition.
- Practice questionsAnswer exam-style questions and get instant AI marking.
- Mock exams & past-paper vaultSit full mocks and see exactly how examiners award marks.
- Personalised study planA daily plan built around your exam date and weak areas.
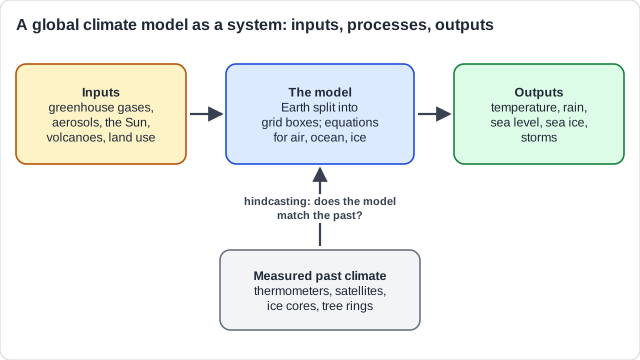
The climate in a computer: Nobody can run an experiment on the real Earth. A global climate model is the next best thing: it splits the planet into grid boxes and uses equations to work out how heat, air and water move between them.
What a climate model is: the points to remember
- A global climate model is a computer program that simulates the climate system.
- It splits the Earth into grid boxes, in layers through the air, ocean, land and ice.
- Equations describe the processes: energy in and out, winds, currents, evaporation, rain, melting.
- It calculates every box step by step, each box passing heat and water to the next (the interactions).
- It is a model: a simplified version of reality, used to predict.
Real example: in 1967 Syukuro Manabe and Richard Wetherald built one of the first climate models. It predicted that doubling the carbon dioxide in the air would warm the Earth by about 2.3 °C. The world has since warmed much as it suggested, and Manabe shared the 2021 Nobel Prize in Physics for this work.
Learn what examiners really want
See exactly what to write to score full marks. Our AI shows you model answers and the key phrases examiners look for.
A model is used like a laboratory. Scientists change the inputs, run the model again and see how the outputs change. Inputs include greenhouse gases and aerosols.
Inputs and outputs: the points to remember
- The model is a system: inputs go in, the equations run, outputs come out.
- Inputs: greenhouse gases, aerosols, the Sun's output, volcanic eruptions, land use.
- Outputs: temperature, rainfall, sea level, sea ice, extreme weather.
- Scientists manipulate the inputs: change one, run again, and compare the outputs.
- So a model can test what if: what if carbon dioxide doubles, or a volcano erupts?
Input
- June 1991: Pinatubo erupts and puts about 15 million tonnes of sulfur dioxide into the stratosphere
Model
- James Hansen's team at NASA add this extra aerosol to their climate model and run it
Output
- The model predicts the whole Earth will cool by about 0.5 °C, most of all in 1992
Test
- Thermometers show the world did cool by about that much in 1992, then warm again as the droplets fell out
Use the word 'manipulate': Say the model manipulates the inputs: one input is changed while the others stay the same, so its effect on the outputs can be seen.
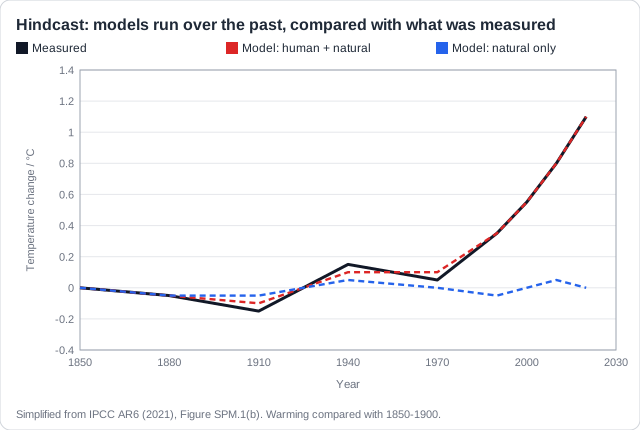
How do we know a model works? Hindcasting runs it backwards from today over years we have already measured. If it gets the past right, we trust its future more.
Hindcasting: the points to remember
- Hindcasting tests a model on the past: it is run backwards from the present over years already measured.
- If its output matches the measured climate, it is more valid, so its future is more trusted.
- Models with natural inputs only (Sun, volcanoes) do not show the warming since 1950.
- Only models with human inputs as well (greenhouse gases, aerosols) match the record.
- This is strong evidence that humans caused the recent warming.
Remember it as: Get the past right, then trust the future.
Real example: in 2020 Zeke Hausfather and others checked 17 model projections published between 1970 and 2007 against the warming that followed. Once the real emissions were put in, 14 of the 17 matched what happened: the models had passed a test set decades earlier.
Never wonder what to study next
Get a personalized daily plan based on your exam date, progress, and weak areas. We'll tell you exactly what to review each day.
A model can only be as good as what goes into it. Because the inputs and some processes are uncertain, models give a range of possible futures, not one answer.
Why models give a range: the points to remember
- Inputs are uncertain: future emissions depend on choices people have not made yet.
- Past inputs come partly from proxies, which are estimates.
- Some processes are smaller than a grid box (clouds) or poorly known (ice sheets), so they are simplified.
- Different models simplify differently, so they give different answers.
- So the output is a range of possible outcomes, not one number.
- Many models together (an ensemble) show the likely range, e.g. 2.5 to 4 °C for doubled CO2.
Strengths
- Test 'what if' choices safely
- Pass hindcasts of the past
- Cover the whole planet
- Many models agree on warming
Limits
- Inputs uncertain (emissions, proxies)
- Clouds smaller than a grid box
- Ice-sheet collapse hard to model
- A range, not one number
Real example: the IPCC's 2021 report used dozens of models from around the world as an ensemble. Their climate sensitivity is likely between 2.5 and 4 °C, with a best estimate of 3 °C. The spread comes mostly from clouds, which the models treat differently.
Uncertain is not useless: A range does not mean the models are wrong. Every model in the range shows warming; the uncertainty is about how much, not whether.
How this comes up: Paper 2, Section A: a graph of measured and modelled temperature to read and explain. Section B: outline how models work or are tested; explain or evaluate why their predictions are uncertain.
Before the IPCC's 2021 report, every climate model was first run from 1850 to the present and compared with the temperatures that were actually measured.
Outline how hindcasting is used to test the validity of global climate models.
Model answer plan
See the mark-by-mark plan — for / against / judgement, with marking guidance — in study mode.