Collecting climate data at Higher Level: This statement is Higher Level only. It is about where climate data come from: direct measurements by weather stations, observatories, radar and satellites, and indirect ones (proxies) from ice cores, tree rings and pollen.
Practise this as you read
- Sort each method into direct or indirect, with one strength and one limit.
- Explain how both kinds of data are used to build and test climate models.
Free preview
This is the free notes preview
You're reading the free notes. Aimnova Pro unlocks the full study experience — and you can try it with your first topic free to keep:
- FlashcardsLock in vocabulary and key terms with spaced repetition.
- Practice questionsAnswer exam-style questions and get instant AI marking.
- Mock exams & past-paper vaultSit full mocks and see exactly how examiners award marks.
- Personalised study planA daily plan built around your exam date and weak areas.
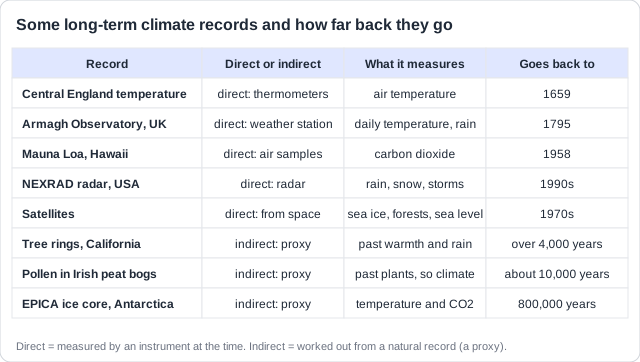
Measuring the climate, year after year: Climate is the average of the weather over decades, so it can only be studied with records that run for a long time. Weather stations and observatory have measured temperature and gases, the same way, in the same place, for decades or centuries.
Direct measurements: the points to remember
- Direct measurements are taken by an instrument at the time: thermometers, rain gauges, air samples.
- Weather stations record temperature, rain and wind every day, some for over 200 years.
- Observatories run long, careful records, e.g. carbon dioxide at Mauna Loa since 1958.
- Long records of temperature and greenhouse gases show the trend, not just one odd year.
- Limits: records are short (about 150 years worldwide) and stations are uneven (few at sea or in Africa).
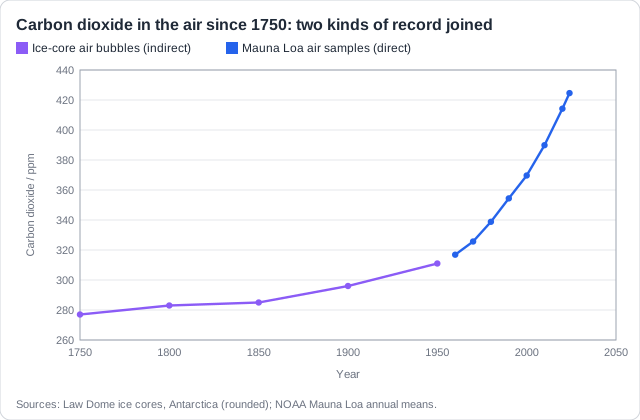
Real example: in 1958 Charles Keeling began measuring carbon dioxide at the Mauna Loa observatory, high on a volcano in Hawaii, far from cities. The yearly average rose from 316.9 ppm in 1960 to 424.6 ppm in 2024. The same method in the same place for over 60 years is what makes the rise impossible to dismiss.
Learn what examiners really want
See exactly what to write to score full marks. Our AI shows you model answers and the key phrases examiners look for.
Weather stations measure one spot. From a distance, radar and satellites fill the gaps: oceans, ice sheets, deserts and forests where nobody lives. They are still direct measurements, taken at the time.
Radar and satellites: the points to remember
- Radar bounces radio waves off rain and snow: it maps where and how hard it falls.
- Satellites measure the whole planet from space, since the 1970s.
- They track sea ice, ice sheets, sea level and temperature, even where no one lives.
- They also show land-use change: forests cleared, cities spreading, wetlands drained.
- The same place photographed year after year makes change easy to measure.
Radar
- The US NEXRAD network: about 160 radars built in the 1990s.
- Maps rain and snow every few minutes; tracks storms and floods.
Ice from space
- The GRACE satellites (from 2002) weigh the ice by its pull of gravity.
- Greenland lost about 270 billion tonnes of ice a year (2002-2023).
Land use
- Landsat has photographed the whole Earth since 1972.
- Brazil has counted Amazon forest loss from these images every year since 1988.
Real example: in the state of Rondônia, Brazil, Landsat images from the 1970s show unbroken forest. Later images show roads cut into it, with farms spreading out from each road like the bones of a fish. This is land-use change, measured from space, year after year.
Nobody measured the climate 10,000 years ago. Scientists read it instead from natural records that changed with the climate: a proxy. These are indirect measurements.
Indirect measurements (proxies): the points to remember
- Indirect measurements read the past from natural records (proxies).
- Ice cores: trapped air bubbles give old CO2; the isotopes of oxygen in the ice give old temperature.
- Tree rings (dendrochronology): wide rings in warm or wet years, narrow in cold or dry ones.
- Pollen in peat cores: each layer holds the pollen of the plants growing then, so it shows the climate then.
- Proxies reach back thousands to 800,000 years, far beyond any thermometer.
- Limits: they are estimates, need checking against direct data, and often tell about one place.
Remember it as: Bubbles for gas, isotopes for heat, rings for years, pollen for plants.
Ice cores
Snow piles up each year and turns to ice. Bubbles trap old air (its CO2). The isotopes of oxygen in the ice show how cold it was: less heavy oxygen means colder.
Tree rings
In dendrochronology, each ring is one year. A wide ring means a warm or wet year; a narrow one a cold or dry year.
Pollen in peat
Bogs build up peat layer by layer. The pollen in each layer shows which plants grew then: birch and pine mean cool; oak and elm mean warmer.
Real example: the EPICA ice core, drilled to over 3 km deep at Dome C in Antarctica, holds ice about 800,000 years old. In California's White Mountains, bristlecone pine rings run back over 4,000 years. Pollen in Irish peat bogs shows tundra plants after the last ice age, then birch, then oak forest as the climate warmed.
Never wonder what to study next
Get a personalized daily plan based on your exam date, progress, and weak areas. We'll tell you exactly what to review each day.
Direct and indirect records are strongest together. Each covers the other's weakness, and climate models need both: one to build and start the model, the other to test it.
Direct and indirect together: the points to remember
- Direct data are accurate but short; indirect data are long but less precise.
- Joined together, they make one long record, e.g. ice-core CO2 joined to Mauna Loa.
- Proxies are calibrated: checked against thermometer years where both exist.
- Climate models are built and started with direct data: today's temperatures, gases, ice.
- Models are tested on the past with both: if a model matches the record, its future is more trusted.
- Proxies show the natural range of past climate, so we can see today's change is outside it.
Direct
- Accurate: measured at the time
- Short: about 150 years worldwide
- Gaps at sea, in Africa, at the poles
- Starts and tests the models
Indirect (proxies)
- Estimates, read from nature
- Long: up to 800,000 years
- Often one place only
- Shows the natural range for testing models
Real example: air from the Law Dome ice cores in Antarctica, trapped in the 1950s and 1960s, gives the same carbon dioxide as the direct air samples measured in Antarctica in those years. That overlap shows the ice cores can be trusted, so the record can be read back to 1750.
Proxies are not guesses: Say how a proxy is checked: it is calibrated against the years when thermometers or air samples also exist. Then its older layers can be read with known accuracy.
How this comes up: Paper 2, Section A: a graph of a long record (carbon dioxide, temperature, sea ice) to describe, calculate from and explain. Section B: outline or explain how direct and indirect data are collected and used, with named examples.
The Intergovernmental Panel on Climate Change (IPCC) uses thermometer records, satellite data and ice cores from Antarctica to describe how the climate has changed.
Explain why both direct and indirect measurements are needed to study climate change.
Model answer plan
See the mark-by-mark plan — for / against / judgement, with marking guidance — in study mode.