The sequence of impacts at Higher Level: The same chain and model as SL, told through the Baltic Sea and Lake Taihu. At HL, use the model to explain what positive feedback does to the equilibrium of the lake, and why a dead zone is slow to recover. Link it to toxic blooms (4.4.10) and to the growth of dead zones (4.4.11).
Practise this as you read
- Draw the model with both positive loops.
- Explain how the loops lead to a tipping point.
Free preview
This is the free notes preview
You're reading the free notes. Aimnova Pro unlocks the full study experience — and you can try it with your first topic free to keep:
- FlashcardsLock in vocabulary and key terms with spaced repetition.
- Practice questionsAnswer exam-style questions and get instant AI marking.
- Mock exams & past-paper vaultSit full mocks and see exactly how examiners award marks.
- Personalised study planA daily plan built around your exam date and weak areas.
One change leads to the next: An algal bloom does not stay a bloom. The algae die, bacteria break them down, and the bacteria use up the oxygen that fish need. Learn it as a chain: each step causes the next.
The points to remember
- Excessive growth of phytoplankton: an algal bloom.
- The bloom shades the water, so rooted water plants die; algae live only days, so they die in huge numbers too.
- High rates of decomposition: bacteria break down the dead matter.
- The bacteria cause rapid consumption of dissolved oxygen.
- Oxygen falls to hypoxia (very low) and then anoxia (none).
- Aquatic life that depends on dissolved oxygen dies: fish, crabs, worms.
Remember it as: Bloom, doom, decay, no air, no life.

Example (HL): the Baltic Sea. Rivers from 14 countries feed blooms of algae and cyanobacteria every summer. The dead matter sinks into the deep basins, where decomposition has left about 60 000 km² of sea bed with little or no oxygen, one of the largest dead zones on Earth.
Study smarter, not longer
Most students waste 40% of study time on topics they already know. Our AI tracks your progress and optimizes every minute.
The end of the chain has its own words. Hypoxia comes first; anoxia can follow. A dead zone is the result.
The points to remember
- Hypoxia: dissolved oxygen below about 2 mg per litre.
- Fish swim away if they can; crabs, clams and worms on the bottom cannot, so they die.
- With no oxygen, bacteria decompose without air and make hydrogen sulphide (rotten-egg smell).
- Many dead zones are seasonal: worst in summer, when warm water holds less oxygen.
- Tolerant species such as some jellyfish survive, so biodiversity falls.
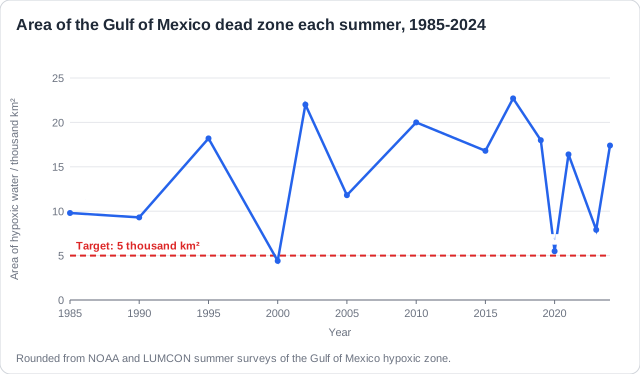
Reading the graph (HL). The area swings from year to year with the size of the spring floods: 22 000 km² after the wet spring of 2002, but only 4400 km² after the drought of 2000. In the Baltic, hypoxic sea bed has grown about tenfold since 1900.
Reading oxygen data: In a table of oxygen by month, the lowest value is usually in July or August. Link it to the chain: spring nutrients, bloom, decomposition, oxygen falls.
A systems model shows the same chain, plus the arrows that loop back. Those loops are positive feedback.

The points to remember
- Loop 1: more nutrients > more death > more decomposition > more nutrients released.
- Loop 2: less oxygen > more animals die > more decomposition > even less oxygen.
- Positive feedback amplifies the change, pushing the system away from its equilibrium.
- Past a tipping point, the lake settles in a new equilibrium: algae dominate, few species.
- Also: dead water plants mean less oxygen made, less food for herbivores, less shelter.
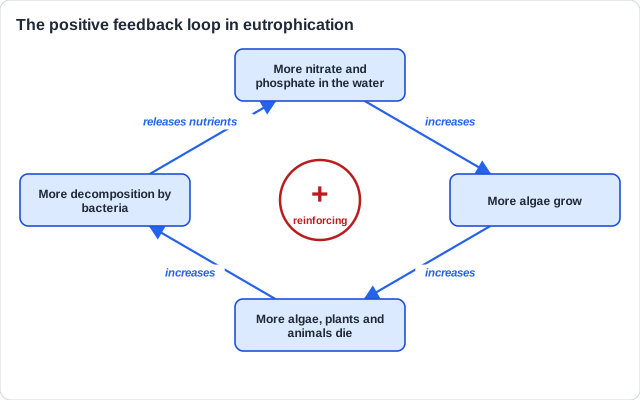
Close the loop: A list of boxes in a line is a chain, not feedback. For full marks, an arrow must lead back to an earlier box, so a change promotes more of the same change.
Practice with exam-style questions
Answer exam-style questions and get AI feedback that shows you exactly what examiners want to see in a full-marks response.
The papers ask you to draw this model. Build it in five moves. Here it is built for Lake Taihu, China, in the summer of 2007.

The input
Box at the top: nitrate and phosphate from Wuxi's sewage and from farms.
The bloom
Arrow to a box: cyanobacteria cover the lake's north bays.
The chain
One box per change: shade, death, decomposition, anoxia, dead fish and snails.
Loop back
Arrow from decomposition to the bloom: phosphate released from the mud feeds more growth.
Label it
Mark each loop + and name the new state: a lake run by algae.
Boxes and arrows: Write a change in each box ('oxygen falls'), not a single word ('oxygen'). Every arrow means 'leads to'. Two loops, both marked +, are better than one.
How this comes up: Paper 2 Section B asks how positive feedback influences the equilibrium of a lake during eutrophication [7]; the answer is the model, explained.
Lake Taihu, China's third largest lake, has had algal blooms almost every summer since the 1990s.
Explain how positive feedback mechanisms may influence the equilibrium of an aquatic ecosystem during the process of eutrophication.
Model answer plan
See the mark-by-mark plan — for / against / judgement, with marking guidance — in study mode.