Biotic indices at Higher Level: This statement is Higher Level only. It turns the animals in a river into a score of water quality, and includes the practical skills of sampling, the Trent biotic index and measuring BOD.
Practise this as you read
- Describe how to assess a discharge with a biotic index.
- Calculate a Trent biotic index and a BOD from data.
Free preview
This is the free notes preview
You're reading the free notes. Aimnova Pro unlocks the full study experience — and you can try it with your first topic free to keep:
- FlashcardsLock in vocabulary and key terms with spaced repetition.
- Practice questionsAnswer exam-style questions and get instant AI marking.
- Mock exams & past-paper vaultSit full mocks and see exactly how examiners award marks.
- Personalised study planA daily plan built around your exam date and weak areas.
Let the animals do the testing: A chemical test shows the water on the day you sample it. The animals have lived in it for months. A biotic index turns what lives there into a single score.
What a biotic index is
- A biotic index scores water quality from the animals living in it.
- It is indirect: it measures the effect on life, not the pollutant itself.
- It uses each species' tolerance, their relative abundance and the diversity of the sample.
- The Trent biotic index (River Trent, England, 1964) runs from 0 (grossly polluted) to 10 (very clean).
- Most use macroinvertebrates: small animals without backbones, big enough to see.
Remember it as: Who lives there tells you what the water is like.
Its strengths
- Shows the actual impact on living things and the ecosystem.
- Shows past pollution within the animals' lifespan, even if the water is clean today.
- Shows the combined effect of several pollutants, and seasonal changes.
- Cheap: no expensive equipment or complex chemical analysis.
- A simple number that non-scientists understand.
Biotic index: strengths
- Actual impact on living things.
- Past pollution, within the animals' lives.
- Combined effects, seasonal changes.
- Cheap; a number anyone understands.
Biotic index: limits
- Does not name the pollutant or its level.
- Does not show the source.
- Numbers change naturally too.
- Needs skill and identification keys.
Answers that score nothing: For a biotic index: not 'it is quicker', 'it gives a number' or 'a reference for the future'. Against it: not 'it is not exact' alone or 'it kills the animals' (they are returned).
See how examiners mark answers
Answer exam-style questions with model answers. Learn exactly what earns marks and what doesn't.
Chemical tests and biotic indices answer different questions, so scientists often use both.
What chemical tests add
- A biotic index does not identify the pollutant or measure its concentration.
- It does not show the source; animal numbers also change naturally.
- Chemical tests are easier and faster to collect: a probe gives a reading on the spot.
- They are more objective: they measure the amount of pollutant directly.
- They identify the pollutant, and testing along a river can help trace its source.
Remember it as: Animals show the harm; chemicals name the culprit.
Real example: England's Environment Agency samples river animals at thousands of sites and also tests the water for chemicals. When the animals below a farm suddenly vanish, the chemical tests show which pollutant, such as ammonia from slurry, did it.
Answers that score nothing: For chemical tests: not 'more accurate' or 'more reliable' alone, and not 'identifies the source' without saying how, such as testing above and below each pipe.
To see whether a discharge harms a river, sample above it and below it in the same way.
The method: a kick sample
- Choose sites at intervals upstream and downstream of the discharge.
- Hold a net downstream of a quadrat on the river bed; kick the stones for a set time.
- Empty the net into a tray; identify the animals with a key.
- Count or estimate the abundance of tolerant and sensitive groups.
- Repeat the sample several times at each site; return the animals.
- Calculate the index at each site and compare upstream with downstream.
Remember it as: Above and below, kick and catch, key and count, repeat and compare.
Sites
Pick sites 50 m upstream and 50 m, 200 m and 500 m downstream of the pipe, with the same depth, speed and stones.
Kick
Lay a quadrat on the bed, hold the net just downstream, and kick the stones for 3 minutes so animals wash into the net.
Sort
Empty the net into a white tray of river water and name each animal with a key.
Count
Record how many groups and how many of each; return the animals to the river.
Compare
Repeat three times per site, work out the index and compare above and below.
Stay on the biotic index: A question on biotic index methods gives no credit for chemical tests, BOD or Simpson's index. Do not sample fish: they swim away.
Study smarter, not longer
Most students waste 40% of study time on topics they already know. Our AI tracks your progress and optimizes every minute.
Worked example: a class sampled Millbrook above and below a sewage works.
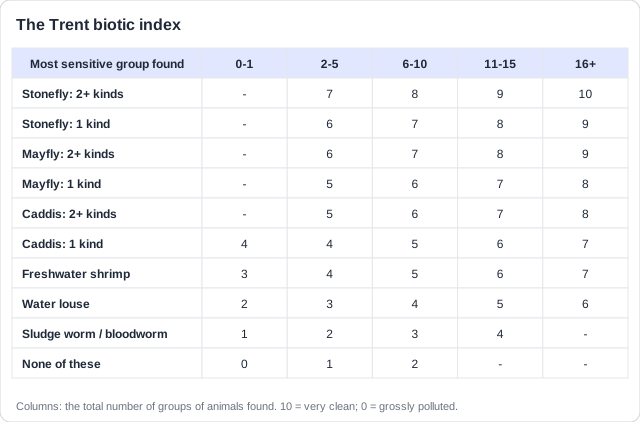
Reading the Trent biotic index
- Count the groups of animals in the sample (each kind of stonefly, mayfly or caddis counts as one).
- Go down the table's first column to the most sensitive group you found.
- Go across that row to the column for the total number of groups.
- The number where they meet is the index: higher means cleaner.
Remember it as: Down to the most sensitive, across to the total.
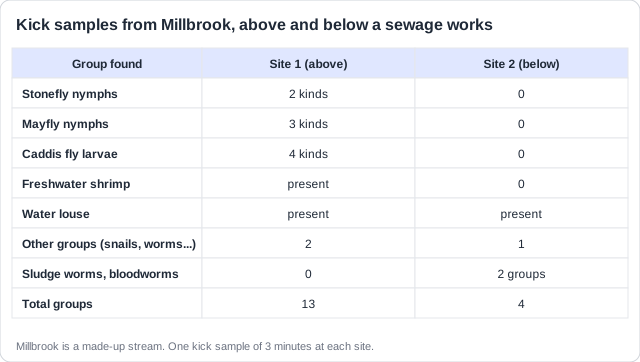
Now find each site's row and column in the Trent table.
Site 1
Most sensitive: stonefly, 2+ kinds. Groups: 13, in the 11-15 column. Index = 9.
Site 2
No stonefly, mayfly, caddis or shrimp: the most sensitive is the water louse. Groups: 4, in the 2-5 column. Index = 3.
Conclude
From 9 to 3 below the works: the effluent is causing serious organic pollution.
The guide also asks you to apply a protocol for biochemical oxygen demand.
Measuring BOD
- BOD = the oxygen used by microorganisms to break down the organic matter in a sample.
- Fill two dark bottles from one sample; measure the oxygen in one now.
- Keep the other sealed, dark, at 20 °C, for 5 days, then measure its oxygen.
- BOD = oxygen on day 0 minus oxygen on day 5, in mg per litre.
- Dark, so algae cannot make oxygen; sealed, so no oxygen gets in.
- High BOD = lots of organic matter = polluted.
Remember it as: Two bottles, five days, dark and 20 °C: BOD is the difference.
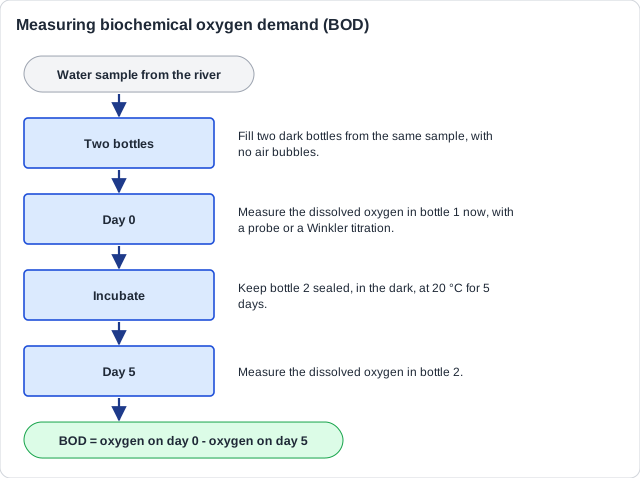
Worked example: a sample from below the Millbrook works had 8.5 mg of oxygen per litre on day 0 and 2.0 mg on day 5. BOD = 8.5 − 2.0 = 6.5 mg per litre. Clean rivers have a BOD below about 3; raw sewage is about 200 to 400. Since 1912, British works have aimed for an effluent BOD of 20 or less.
Practice with exam-style questions
Answer exam-style questions and get AI feedback that shows you exactly what examiners want to see in a full-marks response.
A diversity index, such as Simpson's, also comes from a sample of species. Exams ask how the two compare.
Biotic index v diversity index
- Same: both identify species and sample their abundance.
- Same: both need repeated samples and give one number.
- Different: only a biotic index weights species by tolerance.
- Different: a biotic index measures pollution; a diversity index measures variety and evenness.
- Different: biotic indices are mainly for rivers and use invertebrates; diversity indices fit any ecosystem.
Remember it as: Both count; only the biotic index asks who can stand pollution.
Both
- Identify and count species.
- Repeat samples; one number.
Biotic only
- Weights tolerance.
- Measures pollution, mostly rivers.
Diversity only
- Variety and evenness.
- Any ecosystem, any species.
Two sides, both halves: Give similarities AND differences: one side only is capped at 4 of 7 marks. A difference needs both halves: 'a biotic index weights tolerance, whereas a diversity index treats every species the same'. Naming Simpson's or Trent scores nothing on its own.
How this comes up: Paper 1: 'state one advantage / disadvantage of a biotic index' [1]. Paper 2: 'describe methods to assess the impact of a discharge on the biotic index of a river' [7], or 'describe the similarities and differences between a biotic index and a diversity index' [7].
A paper mill in Scotland releases its waste water into a river. The environment agency wants to know whether the discharge is harming the river's animals.
Describe how a biotic index could be used to assess the impact of the discharge.
Model answer plan
See the mark-by-mark plan — for / against / judgement, with marking guidance — in study mode.