Multiple human impacts at Higher Level: The same ideas as SL, with different cases: Lake Victoria, Tasmania's kelp forests, salted road verges and the Deepwater Horizon oil spill. At HL, expect to explain how impacts amplify each other, and how techniques show the cause.
Practise this as you read
- Link each impact to the next: which one weakens the system?
- Justify every technique you name.
Free preview
This is the free notes preview
You're reading the free notes. Aimnova Pro unlocks the full study experience — and you can try it with your first topic free to keep:
- FlashcardsLock in vocabulary and key terms with spaced repetition.
- Practice questionsAnswer exam-style questions and get instant AI marking.
- Mock exams & past-paper vaultSit full mocks and see exactly how examiners award marks.
- Personalised study planA daily plan built around your exam date and weak areas.
Never just one threat: Most ecosystems face several human impacts at the same time. These impacts are increasing, and together they do more damage than each would do alone.
The points to remember
- Most ecosystems face several human impacts at once: habitat loss, pollution, overharvesting, invasive species, climate change.
- These impacts are increasing, as the human population and its use of resources grow.
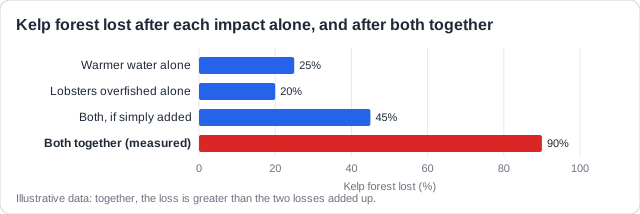
- Combined, their effect is amplified: greater than the sum of each acting alone.
- One impact lowers resilience, so the next does more damage and recovery is slower.
- So tackling one threat alone may not save an ecosystem: the impacts must be managed together.
Remember it as: One plus one makes more than two.
Real example: Lake Victoria, East Africa, once held about 500 kinds of cichlid fish. From the 1950s it faced Nile perch, a large predator brought in for fishing, fertiliser run-off and sewage, the invasive water hyacinth and heavy fishing. About 200 cichlid species have been lost.
Name more than one impact: When you describe a real ecosystem, list every impact it faces, then say how they act together.
Never wonder what to study next
Get a personalized daily plan based on your exam date, progress, and weak areas. We'll tell you exactly what to review each day.
Why is the damage greater together? Because each impact weakens the ecosystem, so it is less able to cope with the next.
The points to remember
- Climate change lowers resilience: stressed, weakened species resist other threats less well.
- Invasive species then spread faster and do more harm than they would alone.
- Fragmentation blocks escape: species cannot move to cooler places as the climate warms.
- Overharvesting removes predators or grazers that would keep a pest or an invader in check.
- Pollution plus warming: warm water holds less oxygen, so eutrophication kills more fish.
Real example: off Tasmania, Australia, a warming current has carried long-spined sea urchins south into the kelp forests, while fishing removed the large rock lobsters that eat them. Urchins grazed the kelp to bare rock: about 95% of Tasmania's giant kelp forest has gone.
Show the link: Listing threats side by side is not enough. Say how one makes another worse: 'warming weakens the corals, so the starfish outbreak kills a larger share'.
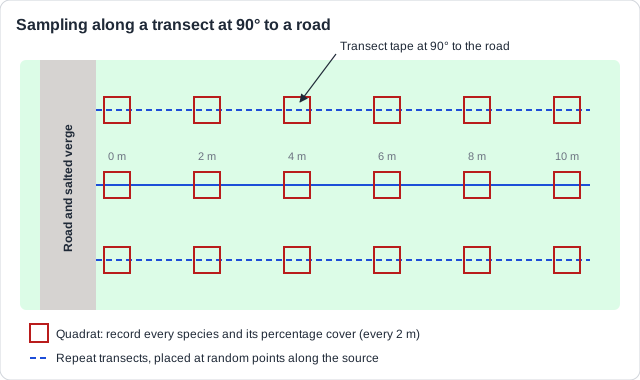
How do scientists show that people are the cause? One way is a transect laid at 90° to the source of the impact.
The points to remember
- Lay a transect at 90° to the source of the impact: a footpath, a road, an outfall pipe, a mine.
- Place quadrats at regular intervals (e.g. every 2 m) and record each species and its abundance (percentage cover or numbers).
- Work out species richness or a diversity index (Simpson's reciprocal index) for each quadrat.
- Measure an abiotic factor too (trampling, soil compaction, salinity, light), to link the change to its cause.
- Repeat several transects, placed at random along the source, for reliability.
- If diversity rises with distance from the source, the human activity is the likely cause.
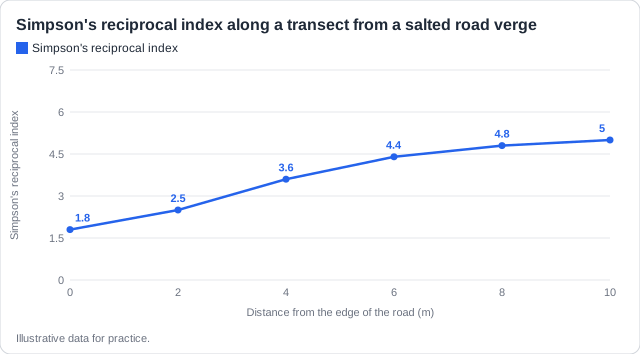
Real example: salt spread on UK roads in winter soaks into the verges. Transects at 90° to a motorway show low diversity near the edge, where salt-tolerant seaside plants such as Danish scurvygrass now grow, and higher diversity further away.
Why at 90°?: A transect at 90° to the source crosses the gradient of the impact, from strongest to weakest, so any change in diversity can be linked to distance from the source.
Stop wasting time on topics you know
Our AI identifies your weak areas and focuses your study time where it matters. No more overstudying easy topics.
The second method compares the same place before and after the activity. Other techniques add evidence, and each has a reason.
The points to remember
- Before and after: sample the same area before the activity and after, with random quadrats within transects.
- Compare with a control site the activity does not reach, sampled at the same time of year.
- Moving animals: mark-release-recapture (the Lincoln index), because quadrats miss animals that move.
- Indicator species show the level of impact: stonefly larvae need clean water; sludge worms tolerate pollution.
- A diversity index combines richness and evenness, so sites and years can be compared fairly.
- Biodiversity also includes habitat and genetic diversity: map the habitats, and sample genes where possible.
- Always give the reason for each technique: evidence of cause, reliability, a fair comparison.
Remember it as: Near and far, before and after: compare, and say why.
Transect at 90° to the source
- Samples near and far at the same time
- Shows a gradient of impact
- Good for a footpath, road or pipe
Before and after
- Samples the same place twice
- Shows change over time
- Needs data from before the activity
Real example: after the Deepwater Horizon oil spill in the Gulf of Mexico (2010), scientists compared deep-sea coral colonies near the well with colonies far away, and with photographs taken before the spill.
Purpose, not detail: In a [7] on techniques, name a real ecosystem and explain why each technique is used. Extra detail of the method, or what the results might be, adds nothing.
How this comes up: Paper 2, Section B (b): explain how ecological techniques can study the effect of a human activity on the biodiversity of a named ecosystem [7].
A new road is to be built through Wytham Woods, an ancient woodland near Oxford, England.
Explain how ecological techniques could be used to study the effects of the road on the biodiversity of the woodland.
Model answer plan
See the mark-by-mark plan — for / against / judgement, with marking guidance — in study mode.