Population growth curves at Higher Level: The same curves as SL. At HL, practise switching between numbers and rates, and explaining each phase with its cause.
Practise this as you read
- Read a growth rate graph as well as a numbers graph.
- Explain each phase of a curve with the factor behind it.
Free preview
This is the free notes preview
You're reading the free notes. Aimnova Pro unlocks the full study experience — and you can try it with your first topic free to keep:
- FlashcardsLock in vocabulary and key terms with spaced repetition.
- Practice questionsAnswer exam-style questions and get instant AI marking.
- Mock exams & past-paper vaultSit full mocks and see exactly how examiners award marks.
- Personalised study planA daily plan built around your exam date and weak areas.
Growth with no brakes: With nothing to limit it, a population grows in an exponential way, drawn as a J-shaped curve.
The points to remember
- With no limiting factors, a population grows exponentially: a J-curve.
- Growth is slow at first, because few individuals are breeding.
- Then it gets faster and faster: more individuals breed, so even more young are born.
- J-curve growth happens when a species reaches a new place with plenty of resources and no predators.
- It cannot last: resources run out, so the population often crashes.
Remember it as: J for 'just keeps going': until the food runs out.
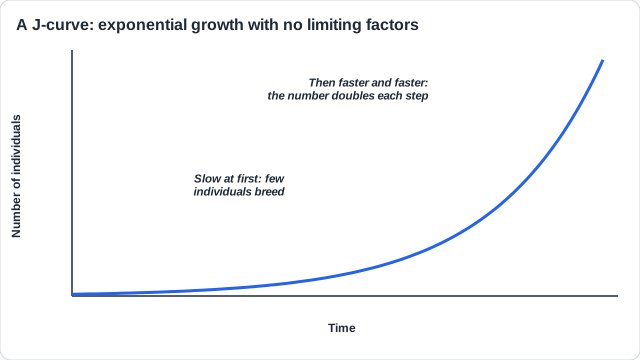
Real example: 101 cane toads were released in Queensland, Australia, in 1935; with no predators able to eat them, there are now over 200 million.
Stop wasting time on topics you know
Our AI identifies your weak areas and focuses your study time where it matters. No more overstudying easy topics.
Growth with brakes: When density-dependent factors start to act, growth slows and the population levels off: an S-shaped curve.
The points to remember
- When density-dependent limiting factors start to act, the curve becomes S-shaped.
- Lag phase: few individuals, growth is slow.
- Exponential phase: plenty of resources, fast growth.
- Transitional phase: competition, predation and disease grow (environmental resistance), so growth slows.
- Plateau: the population levels off at the carrying capacity (K), with small rises and falls.
Remember it as: S for 'slows and settles': lag, fast, slowing, level.
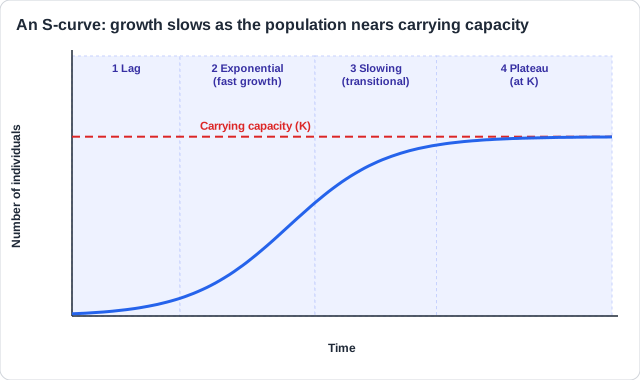
Real example: sheep brought to Tasmania in the early 1800s increased fast, then levelled off at under two million by the 1850s: an S-curve.
A growth curve can show how many individuals there are, or how fast the number is changing. The exam can give you either.
The points to remember
- The number of individuals is how big the population is; the growth rate is how many are added each year.
- On a J-curve, the growth rate keeps rising.
- On an S-curve, the growth rate rises, peaks at about half of K, then falls to zero at K.
- The number keeps rising as long as the growth rate is above zero, even while the rate is falling.
- A negative growth rate means the population is shrinking.
Remember it as: Numbers: how many. Rate: how fast. Fastest at half K, zero at K.
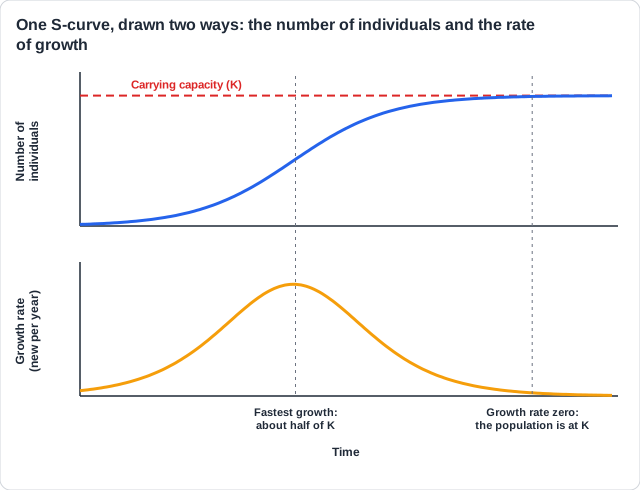
Read the axis first: A falling growth rate does not mean a falling population. The population falls only when the rate is below zero.
See how examiners mark answers
Access past paper questions with model answers. Learn exactly what earns marks and what doesn't.
Boom and bust: Some populations do not level off. They boom, overshoot their carrying capacity, and crash.
The points to remember
- A population with plenty of food and no predators grows as a J-curve.
- The limiting factors act too late, so it overshoots its carrying capacity.
- It eats its food faster than the food can regrow and damages its habitat.
- Then it crashes: many starve (the bust).
- The damaged habitat now supports fewer than before: the carrying capacity has fallen.
Remember it as: Boom, overshoot, bust: and less food afterwards.
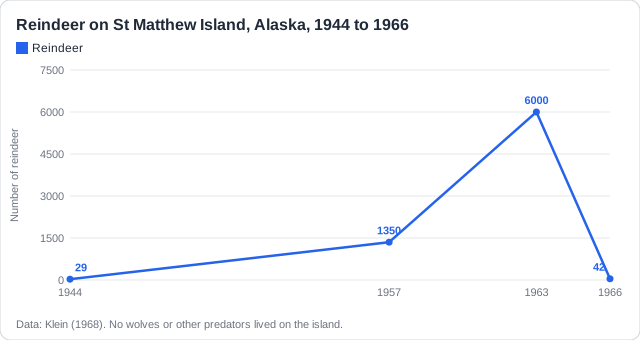
The guide's example: In 1944, 29 reindeer were released on St Matthew Island, Alaska, where no predators lived. They ate the slow-growing lichen faster than it could regrow. In the hard winter of 1963-64 most starved; by 1966, 42 were left.
Real example: 25 reindeer released on St Paul Island, Alaska, in 1911 rose to about 2000 by 1938, then crashed to 8 by 1950 after they had eaten the lichen.
How this comes up: Paper 2, Section B (b): explain why a named species follows an S-curve [7]. Data questions give J- and S-curves to identify, a carrying capacity to read off, or a boom and bust to explain.
Studies of wildebeest in the Serengeti, Tanzania have followed the herd's numbers for many years.
With reference to a named herbivore species, explain why its population growth curve follows an S-shape.
Model answer plan
See the mark-by-mark plan — for / against / judgement, with marking guidance — in study mode.