Limiting factors at Higher Level: The same statement as SL. HL papers set the full practical: a calculated mean rate, the controlled variables and the role of a heat filter.
Practise this as you read
- Design a fair test of one limiting factor.
- Explain a rate curve with limiting factors.
Free preview
This is the free notes preview
You're reading the free notes. Aimnova Pro unlocks the full study experience — and you can try it with your first topic free to keep:
- FlashcardsLock in vocabulary and key terms with spaced repetition.
- Practice questionsAnswer exam-style questions and get instant AI marking.
- Mock exams & past-paper vaultSit full mocks and see exactly how examiners award marks.
- Personalised study planA daily plan built around your exam date and weak areas.
The big idea: Photosynthesis needs three things to go fast: light, carbon dioxide (CO₂) and a suitable temperature.
The limiting factor
- At any moment, the rate of photosynthesis is set by whichever of these is in shortest supply. That one is called the limiting factor.
- Raising the limiting factor speeds up photosynthesis.
- Raising any of the others does not, because they are not what is holding the rate back.
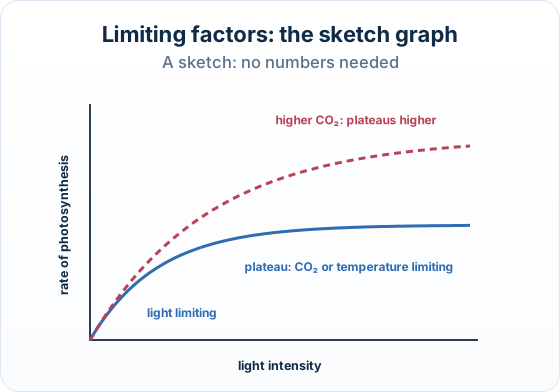
As light intensity rises the rate of photosynthesis increases (light is limiting), then levels off at a plateau where another factor — carbon dioxide concentration or temperature — becomes the limiting factor.
Interactive diagram
Explore the labelled diagram, charts and maps for this topic in full study mode.
- Rate of photosynthesis
- How fast photosynthesis happens — for example, how much oxygen is released or how much carbon dioxide is taken up per minute.
- Limiting factor
- The one factor, in shortest supply, that is holding back the rate of a process. Only by increasing the limiting factor can the rate increase.
- Light intensity
- How bright the light is. Light provides the energy for photosynthesis, so low light slows the rate.
- Carbon dioxide concentration
- The amount of CO₂ available. CO₂ is a raw material of photosynthesis, so low CO₂ slows the rate.
- Plateau
- The flat part of a rate graph where the rate stays the same even as one factor keeps increasing — a sign that this factor is no longer the limiting one.
Only one factor limits at a time: Think of a production line: the slowest step sets the speed of the whole line.
In photosynthesis, whichever resource is lowest sets the rate. Adding more of a resource that is already plentiful changes nothing — only adding more of the limiting factor speeds things up.
Learn what examiners really want
See exactly what to write to score full marks. Our AI shows you model answers and the key phrases examiners look for.
The most-tested idea in this micro is a graph of rate of photosynthesis against light intensity. The curve rises, then flattens into a plateau.
To explain it, look at the curve in two halves, and ask which factor is limiting in each half.
Step 1 — the rising part: light is limiting: When light is dim, there is not enough light energy to drive photosynthesis quickly. Here light intensity is the limiting factor.
As you turn the light up, the rate increases in step with it — more light energy means more photosynthesis. This is the steep, sloping part of the curve.
Step 2 — the plateau: another factor limits: Eventually the rate stops climbing and goes flat, even though the light keeps getting brighter. Light is now so plentiful that it is no longer limiting.
Something else must now be holding the rate back — usually the carbon dioxide concentration (or the temperature). On the plateau, CO₂ or temperature is the limiting factor, not light.
On the rising part of the curve, light is the limiting factor; on the flat plateau, light is no longer limiting and CO₂ concentration (or temperature) limits the rate instead.
Interactive diagram
Explore the labelled diagram, charts and maps for this topic in full study mode.
Reading a second curve (higher CO₂): Exam graphs often show two curves: the same plant at a low CO₂ level and a higher CO₂ level.
How to read them
- The higher-CO₂ curve plateaus higher up: with more CO₂ available, light can keep increasing the rate for longer before another factor takes over.
- A marked point on the rising part of a curve: light is limiting there.
- A marked point on the plateau: CO₂ (or temperature) is limiting.
| Region of the curve | What the rate is doing | Which factor is limiting? |
|---|---|---|
| Steep rising part (low light) | Rate increases as light intensity increases | Light intensity is limiting |
| Flat plateau (high light) | Rate stays the same even as light keeps increasing | Light is NOT limiting — CO₂ or temperature now limits the rate |
Rising part of the curve
- Light is dim (low intensity)
- Rate increases as light increases
- Light intensity is the limiting factor
- Add more light → rate goes up
Flat plateau
- Light is bright (high intensity)
- Rate stays the same as light increases
- CO₂ or temperature is the limiting factor
- Add more light → no change; add more CO₂ → rate goes up
Temperature can both raise AND wreck the rate: Temperature is different from the other two. Photosynthesis uses enzymes, so warming up (towards the optimum) speeds the rate.
But push the temperature too high and the enzymes denature (their shape is destroyed). The rate then falls sharply and can drop to zero — so a temperature curve rises to a peak, then crashes, rather than holding a plateau.
Remember it as: Slope = the thing on the axis is limiting. Flat = something else is.
On a rate-vs-light graph: while it climbs, light limits; once it's flat, CO₂ or temperature limits.
Sketching the graph. A question may ask you to draw it and label the two regions:
Because photosynthesis releases oxygen and uses up carbon dioxide, we can measure how fast it is going by tracking either gas.
Three common ways
- Measure the oxygen produced
- Measure the carbon dioxide taken up
- Measure the pH of the surrounding water (which changes as carbon dioxide levels change)
| Gas | What photosynthesis does to it | Why |
|---|---|---|
| Oxygen (O₂) | Released (given off) — a waste product | Oxygen is split off from water during the reaction |
| Carbon dioxide (CO₂) | Absorbed (taken in) — a raw material | CO₂ supplies the carbon that is built into glucose |
1. Count the oxygen bubbles: An aquatic plant (such as pondweed) in bright light releases bubbles of oxygen from its cut stem.
The faster it photosynthesises, the more bubbles are given off each minute. Counting bubbles (or collecting and measuring the volume of gas) is a simple measure of the rate.
In a leaf, carbon dioxide diffuses IN and oxygen diffuses OUT through the stomata. In an aquatic plant the released oxygen escapes as visible bubbles you can count.
Interactive diagram
Explore the labelled diagram, charts and maps for this topic in full study mode.
2. Use a carbon dioxide indicator: A CO₂ (hydrogencarbonate) indicator changes colour depending on how much carbon dioxide is dissolved in the water.
How to read it
- As a plant photosynthesises it removes carbon dioxide, so the indicator's colour shifts, showing that CO₂ has been used up.
- The bigger the colour change, the more photosynthesis has happened.
Data question: This is a favourite data question: you are shown the colour (or a result) and have to work out which tube had the least carbon dioxide left in the water.
3. Track the pH: Dissolved carbon dioxide makes water slightly acidic (it forms a weak carbonic acid).
When a plant photosynthesises and removes CO₂, there is less acid, so the pH rises (goes up).
Measuring the pH is therefore an indirect way to measure the rate — a rising pH means carbon dioxide is being taken in faster.
Oxygen produced
- Photosynthesis releases oxygen
- Count bubbles from an aquatic plant
- Or collect and measure the volume of gas
- More gas per minute = faster rate
Carbon dioxide used
- Photosynthesis absorbs carbon dioxide
- A CO₂ indicator changes colour as CO₂ falls
- Or the pH rises as CO₂ is removed
- Bigger colour / pH change = faster rate
Why pH goes UP, not down: Removing carbon dioxide removes acid from the water, so the pH rises.
A common slip is to think more activity makes water more acidic — but for photosynthesis it is the opposite: CO₂ out → less acid → higher pH.
Never wonder what to study next
Get a personalized daily plan based on your exam date, progress, and weak areas. We'll tell you exactly what to review each day.
The big idea: Change one factor, keep the other two constant, and measure the rate each time. Then the change in rate can only come from the factor you changed.
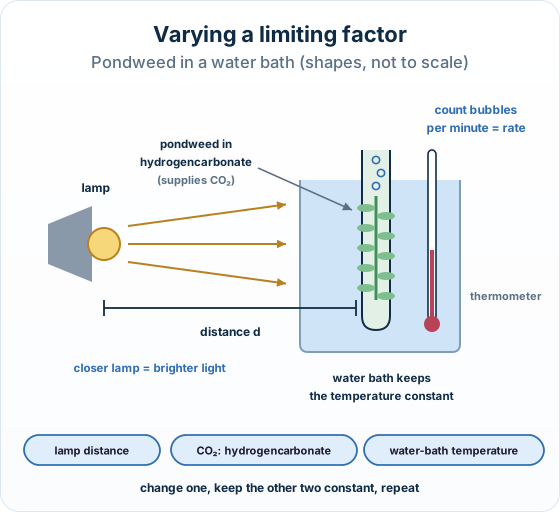
| Factor to vary | How to vary it | Keep constant |
|---|---|---|
| Light intensity | Move the lamp closer or further (measure the distance) | Carbon dioxide, temperature |
| Carbon dioxide | Use different concentrations of hydrogencarbonate solution | Light, temperature |
| Temperature | Stand the tube in water baths at different temperatures | Light, carbon dioxide |
The points to remember
- Change one factor at a time; keep the other limiting factors constant.
- Hydrogencarbonate solution supplies the carbon dioxide.
- A water bath (or a beaker of water as a heat filter) keeps the temperature constant.
- Measure the rate as bubbles (or volume of oxygen) per minute, or leaf discs floating per minute.
- Repeat each reading and take a mean.
Remember it as: One change, two kept the same, measure, repeat.
Real example: the heat filter. A lamp close to the plant also warms it. A beaker of water placed between the lamp and the plant absorbs much of the heat, so the temperature stays constant while the light intensity changes.
Trap: Moving a lamp closer also heats the plant. Without a water bath or heat filter, temperature changes too, so the test is not fair.
How this is tested: This micro is a graph-reading question. It comes in three forms.
The common formats
- Multiple choice, 1 mark (Identify): a rate-vs-light-intensity curve (sometimes at two CO₂ levels). Identify the limiting factor at a marked point: light on the rising part, CO₂ on the plateau.
- Written, 3 marks (Explain): why the curve rises then plateaus. Link the rising part to light being limiting and the plateau to another factor (CO₂ or temperature) taking over.
- Predict: what happens to the rate as temperature rises beyond the plotted range. It falls as enzymes denature.
Exam-style question — explain the shape of the curve
A graph shows the rate of photosynthesis of pondweed plotted against light intensity. The rate rises steeply at first, then levels off at a plateau. Explain the shape of this curve. [3]
Step by step
- Explain the rising part. At low light intensity, light is the limiting factor, so as light intensity increases the rate of photosynthesis increases.
- Explain why it levels off. At high light intensity the rate reaches a plateau because light is no longer the limiting factor — increasing it further has no effect.
- Name the new limiting factor. On the plateau another factor — the carbon dioxide concentration (or the temperature) — is now limiting the rate.
Final answer
On the rising part, light intensity is limiting, so more light gives a faster rate. At the plateau, light is no longer limiting; another factor — CO₂ concentration or temperature — now limits the rate, so adding more light has no effect.
Why this works: A full answer links three points: light limiting while the rate rises; light no longer limiting on the plateau; a named new limiting factor (CO₂ or temperature).
An 'explain' answer gives the reason, not just the curve's shape.
| Limiting factor | How it limits photosynthesis | What raising it does (while it is limiting) |
|---|---|---|
| Light intensity | Light supplies the energy that drives photosynthesis; too little light slows the rate | Raising light intensity increases the rate |
| Carbon dioxide concentration | CO₂ is a raw material that is built into sugars; too little CO₂ slows the rate | Raising CO₂ concentration increases the rate |
| Temperature | Photosynthesis uses enzymes, which work fastest at their optimum temperature | Raising temperature increases the rate — but only up to the optimum |
Another question in the papers' style:
A beaker of water is placed between the lamp and a tube of pondweed. Suggest its purpose.
Model answer plan
See the answer broken into clear points, with guidance on how each point earns marks.