Rate factors at Higher Level: The same statement as SL. HL questions pick the right graph shape or explain data from experiments; at HL the substrate-concentration graph is also how inhibitors are told apart.
Practise this as you read
- Explain each region of a temperature, pH or substrate graph.
- Interpret data from enzyme experiments.
Free preview
This is the free notes preview
You're reading the free notes. Aimnova Pro unlocks the full study experience — and you can try it with your first topic free to keep:
- FlashcardsLock in vocabulary and key terms with spaced repetition.
- Practice questionsAnswer exam-style questions and get instant AI marking.
- Mock exams & past-paper vaultSit full mocks and see exactly how examiners award marks.
- Personalised study planA daily plan built around your exam date and weak areas.
The big idea: An enzyme is a biological catalyst: it speeds up a reaction without being used up. How fast it works (its rate) depends on three things.
Three factors to explain and read from a graph
- 1. Temperature
- 2. pH
- 3. Substrate concentration
Read the shape: Each one has its own shaped graph, and each shape has a story about what is happening to the enzyme.
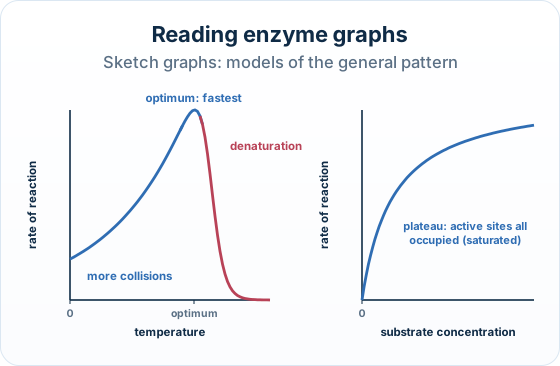
The three classic enzyme-rate graphs: rate rises to an optimum temperature then falls as the enzyme denatures; rate peaks at an optimum pH; and rate rises with substrate concentration then plateaus once every active site is saturated.
Interactive diagram
Explore the labelled diagram, charts and maps for this topic in full study mode.
- Enzyme
- A protein that acts as a biological catalyst, speeding up a specific reaction without being used up.
- Active site
- The part of the enzyme with a specific shape that the substrate fits into. Its shape is what gives the enzyme its job.
- Substrate
- The molecule an enzyme acts on. It binds to the active site, where it is changed into product.
- Optimum
- The temperature or pH at which an enzyme works fastest — the peak of the graph.
- Denaturation
- A permanent change to the SHAPE of an enzyme's active site (caused by high temperature or extreme pH) so the substrate no longer fits and the enzyme stops working.
- Saturation
- The point where every active site is occupied by substrate, so adding more substrate cannot increase the rate.
Why shape is everything: An enzyme only works because its active site has a shape that the substrate fits into.
Anything that changes that shape — like too much heat or the wrong pH — stops the enzyme working. This single idea explains almost every enzyme graph.
Learn what examiners really want
See exactly what to write to score full marks. Our AI shows you model answers and the key phrases examiners look for.
Each factor changes the rate for a different reason. Work through them one at a time, always asking: what is happening to the active site or to the collisions?
Temperature — up to a point: As temperature rises, molecules move faster, so the substrate collides with the active site more often, and the rate increases.
The optimum and beyond
- This continues only up to the optimum temperature, where the rate is highest (about 37 degrees C for many human enzymes).
- Above the optimum the rate falls sharply: the heat denatures the enzyme.
- The active site changes shape, so the substrate no longer fits and the reaction stops.
Read the temperature graph (left): the rate climbs to a peak at the optimum, then drops sharply because high heat denatures the enzyme — the active site changes shape and the substrate no longer fits.
Interactive diagram
Explore the labelled diagram, charts and maps for this topic in full study mode.
pH — a peak either side of which it falls: Every enzyme has an optimum pH where its active site is the right shape and the rate is highest. Move the pH too far either way (too acidic or too alkaline) and the active site is distorted: the enzyme is denatured and the rate drops.
Different enzymes, different optimum pHs: A stomach enzyme works best in very acidic conditions, while many others prefer a near-neutral pH.
Substrate concentration — until the sites are full: Adding more substrate gives more molecules to collide with active sites, so at first the rate increases. Eventually the rate levels off: a plateau.
Why the rate plateaus
- At the plateau every active site is occupied (the enzymes are saturated), so the substrate has to wait for a site to become free.
- Adding even more substrate cannot speed things up.
- The number of enzymes is now the limiting factor, not the substrate.
Read the substrate-concentration graph (right): the rate rises then levels off (plateau). At the plateau every active site is occupied — the enzymes are saturated, so adding more substrate cannot speed the reaction up.
Interactive diagram
Explore the labelled diagram, charts and maps for this topic in full study mode.
Denaturation (temperature & pH graphs)
- Caused by high temperature or extreme pH
- The active-site shape is changed
- Substrate no longer fits → rate falls
- Usually permanent (cannot recover)
Saturation (substrate graph)
- Caused by high substrate concentration
- All active sites are occupied
- Rate plateaus (stays constant)
- Enzyme is unharmed — just fully busy
An easy way to remember: Denatured = shape destroyed (heat or pH wrecks the active site → rate falls).
Saturated = sites all seated (every active site is taken → rate plateaus, but the enzyme is fine).
| Factor | Below the optimum | At the optimum | Past / above the optimum |
|---|---|---|---|
| Temperature | Rate is slow — molecules move slowly, so fewer collisions with the active site | Rate is highest — fastest successful collisions | Rate falls sharply — heat DENATURES the enzyme (active site changes shape) |
| pH | Rate is low — the wrong pH distorts the active site | Rate is highest at the enzyme's optimum pH | Rate falls — too acidic or too alkaline DENATURES the enzyme |
| Substrate concentration | Rate rises as more substrate is added (more collisions) | — | Rate PLATEAUS — all active sites are full (enzyme is saturated); rate is now limited by enzyme number |
The big idea: Every region of an enzyme graph has one reason: more collisions, denaturation or saturation. Name the region, then give its reason.
The points to remember
- Rise with temperature: faster molecules, more collisions with active sites.
- Fall above the optimum, or away from the optimum pH: the enzyme is denatured.
- Plateau at high substrate concentration: all active sites are occupied.
- These smooth sketch graphs are models of the general pattern; results from real enzyme experiments are used to test them.
Remember it as: Rise = collisions; fall = denaturation; plateau = saturation.
Real example: trypsin. Trypsin digests proteins in the small intestine, where the pH is about 8 and the temperature about 37 °C, close to its optimum conditions.
Trap: A plateau is not denaturation. At the plateau the enzyme is unharmed; it is simply working as fast as it can.
Never wonder what to study next
Get a personalized daily plan based on your exam date, progress, and weak areas. We'll tell you exactly what to review each day.
How this is tested: This is the most-examined part of enzymes, and it is a data-question favourite.
| Type | What you are given and asked | The answer |
|---|---|---|
| Written | A rate-versus-temperature graph: label the point of highest rate (the optimum), then outline why the rate falls above it. | Denaturation. |
| Data question | A graph (for example, enzyme activity at different storage temperatures): explain the relationship shown. | Read the trend off the graph, then give the biological reason. |
| Multiple choice | A 1-mark question: explain the plateau on a rate-versus-substrate-concentration graph. | Saturation of the active sites. |
Exam-style question — explain a temperature graph
A graph shows the rate of an enzyme-controlled reaction against temperature. The rate rises to a peak at 40 degrees C and then falls steeply. Explain the shape of this graph. [4]
Step by step
- Below the optimum — why the rate rises. As temperature increases, molecules gain kinetic energy and move faster, so substrate and enzyme collide more often, increasing the rate.
- At the optimum — name the peak. The rate is highest at the optimum temperature (40 degrees C), where collisions are most frequent and the active site is the correct shape.
- Above the optimum — name the cause. Above the optimum the high temperature denatures the enzyme.
- Above the optimum — explain the mechanism. Denaturation changes the shape of the active site, so the substrate no longer fits, and the rate falls steeply.
Final answer
Rising part: higher temperature → faster molecules → more frequent collisions → faster rate. Peak: the optimum temperature. Falling part: heat denatures the enzyme, changing the active-site shape so the substrate no longer fits, and the rate drops.
Why this works: It explains all three regions of the curve — the rise, the peak and the fall — and for the fall it gives both the keyword (denaturation) and the mechanism (active-site shape changes so the substrate cannot fit).
Saying only 'the enzyme denatures' without explaining the active site is not enough.
Read the temperature graph (left): the rate climbs to a peak at the optimum, then drops sharply because high heat denatures the enzyme — the active site changes shape and the substrate no longer fits.
Interactive diagram
Explore the labelled diagram, charts and maps for this topic in full study mode.
Another question in the papers' style:
Samples of an enzyme were stored at 30 °C, 45 °C and 60 °C, and their activity was measured every 10 minutes. Activity fell fastest at 60 °C. Explain the relationship between storage temperature and enzyme activity.
Model answer plan
See the answer broken into clear points, with guidance on how each point earns marks.