Activation energy at Higher Level: The same statement as SL. HL questions ask you to read profiles, including those of anabolic reactions, where the products end higher than the reactants.
Practise this as you read
- Identify activation energy and energy released on a profile.
- Explain how an enzyme speeds up a reaction.
Free preview
This is the free notes preview
You're reading the free notes. Aimnova Pro unlocks the full study experience — and you can try it with your first topic free to keep:
- FlashcardsLock in vocabulary and key terms with spaced repetition.
- Practice questionsAnswer exam-style questions and get instant AI marking.
- Mock exams & past-paper vaultSit full mocks and see exactly how examiners award marks.
- Personalised study planA daily plan built around your exam date and weak areas.
The big idea: Even a reaction that releases energy overall will not just happen on its own. It first needs a small 'push' of energy to get started.
Activation energy and enzymes
- That starting push is the activation energy (Eₐ): the minimum energy the reactants must have before the reaction can begin.
- An enzyme is a biological catalyst that lowers the activation energy.
- With a lower barrier to climb, the reaction can happen much faster.
- The enzyme itself is not used up.
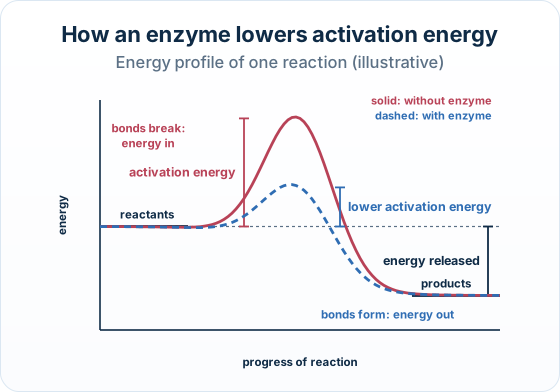
An energy profile: both routes start at the reactants level and finish at the same products level, but the enzyme route climbs a much lower activation-energy barrier than the uncatalysed route.
Interactive diagram
Explore the labelled diagram, charts and maps for this topic in full study mode.
- Activation energy (Eₐ)
- The minimum amount of energy that reactants must have for a reaction to start. On an energy profile it is the height of the 'hill' from the reactants up to the peak.
- Energy profile
- A graph showing how the energy of a reacting system changes as a reaction proceeds, from reactants on the left to products on the right.
- Reactants (substrate)
- The starting molecules of a reaction — shown by the energy level on the left of the profile.
- Products
- The molecules made by the reaction — shown by the energy level on the right of the profile.
- Catalyst / enzyme
- A substance that speeds up a reaction by lowering its activation energy, without being used up or changed permanently itself.
Why the 'hill' picture works: Think of the reaction as rolling a ball over a hill.
The height of the hill is the activation energy — the bigger the hill, the harder it is to get over.
An enzyme does not flatten the start or the end; it simply provides a lower hill to cross.
Study smarter, not longer
Most students waste 40% of study time on topics they already know. Our AI tracks your progress and optimizes every minute.
In an exam you are usually shown an energy profile with two curves: one for the reaction without an enzyme and one with an enzyme.
What the two curves share
- Both curves start at the same reactants level.
- Both end at the same products level.
- The enzyme changes only the height of the barrier between them, not the energy of the reactants or products.
What each part of the graph means: Reading from left to right:
the curve starts at the energy of the reactants; it rises to a peak (the transition state); then it falls to the energy of the products.
The activation energy is the height from the reactants up to the peak. The energy released by the reaction is the drop from the reactants down to the products.
Activation energy is the height of the 'hill' from the reactants up to the peak. The enzyme provides a lower path, so less energy is needed to start the reaction.
Interactive diagram
Explore the labelled diagram, charts and maps for this topic in full study mode.
| Region on the energy profile | What it represents | How to read it off the graph |
|---|---|---|
| Starting level (left) | The energy of the reactants (substrate) | The height of the curve where it begins, on the left |
| The peak (top of the hill) | The transition state — the most unstable point | The highest point the curve reaches |
| Height from start up to the peak | The activation energy (Eₐ) | Measure UP from the reactants level to the peak |
| Finishing level (right) | The energy of the products | The height of the curve where it ends, on the right |
| Drop from start down to the end | The energy released by the reaction | Measure from the reactants level down to the products level |
How the enzyme lowers the barrier: The enzyme route reaches a lower peak, so its activation energy is smaller. Because the barrier is lower, more of the reactant particles already have enough energy to react at any moment, so the reaction proceeds faster.
The start and end levels are unchanged: An enzyme speeds the reaction up. It does not change how much energy is released or make a non-spontaneous reaction spontaneous.
Without enzyme
- Tall activation-energy barrier
- A lot of energy needed to start
- Few particles can react → slow
- Reactants and products at the same levels
With enzyme
- Low activation-energy barrier
- Less energy needed to start
- Many particles can react → fast
- Reactants and products at the same levels
An easy way to remember: Lower barrier = faster reaction. The enzyme cuts down the middle of the graph (the Eₐ), never the ends (the reactants and products).
If a curve has a shorter hill, it is the enzyme-catalysed one.
The big idea: Breaking bonds in the substrate needs energy; making the new bonds of the products releases energy. An enzyme lowers the activation energy, the energy needed to start.
The points to remember
- Activation energy = the energy needed to break bonds and start the reaction: the climb to the peak.
- Forming new bonds in the products releases energy: the fall after the peak.
- An enzyme lowers the peak, so more substrate molecules can react each second: a faster rate.
- The enzyme does not change the energy of the reactants or the products, or the overall energy change.
Remember it as: Lower barrier, faster reaction: same start, same finish.
Real example: orotidine decarboxylase. One reaction in making DNA and RNA nucleotides would take about 78 million years to go halfway without its enzyme. Orotidine decarboxylase lowers the activation energy so far that it happens in a fraction of a second.
Trap: In an anabolic reaction the products end higher than the reactants: energy is taken in. The enzyme still only lowers the peak.
Practice with exam-style questions
Answer exam-style questions and get AI feedback that shows you exactly what examiners want to see in a full-marks response.
How this is tested: You will be asked to read an energy profile and link a lower barrier to a faster reaction.
| Format | What you are asked | The answer |
|---|---|---|
| Multiple choice | An energy profile with and without an enzyme: identify what the labelled regions (such as X, Y and Z) represent. | Typically the reactants level, the activation energy and the energy released. |
| Data-style | You are given the two activation-energy barriers: deduce which curve is the enzyme-catalysed one. | Always the curve with the lower barrier. |
Be ready to explain: You should also be ready to explain how lowering the activation energy makes the reaction faster.
Exam-style question — identify the labelled regions of an energy profile
An energy profile shows a reaction proceeding from reactants to products. Region X is the height of the curve where it begins; region Y is the height from the start of the curve up to its peak; region Z is the difference between the starting and finishing levels. State what each of X, Y and Z represents. [3]
Step by step
- Region X — the starting level. X is the energy of the reactants (the substrate), read off the left-hand end of the curve.
- Region Y — start up to the peak. Y is the activation energy (Eₐ) — the minimum energy needed to start the reaction, measured from the reactants up to the peak.
- Region Z — start down to the end. Z is the energy released by the reaction — the difference between the reactants' energy and the (lower) products' energy.
Final answer
X = energy of the reactants; Y = activation energy (Eₐ); Z = energy released (the difference between reactants and products).
Why this works: Each label is read off a specific part of the curve: the start (reactants), the rise to the peak (activation energy), and the start-to-finish drop (energy released).
Naming the activation energy as the height up to the peak — not the whole curve — is the key point.
| Feature | Without enzyme | With enzyme |
|---|---|---|
| Activation energy (Eₐ) | High — a tall barrier to climb | Low — a much shorter barrier |
| Energy needed to start | A lot of energy is needed | Far less energy is needed |
| Rate of reaction | Slow (few particles have enough energy) | Fast (many particles can react) |
| Reactants' energy | Same starting level | Same starting level (unchanged) |
| Products' energy | Same finishing level | Same finishing level (unchanged) |
Another question in the papers' style:
Outline the energy changes during an enzyme-catalysed reaction.
Model answer plan
See the answer broken into clear points, with guidance on how each point earns marks.