aımnova
DashboardMy LearningCrash CoursesStudy Plan

Aimnova site navigation

Stay in the loop

Get the latest study resources and updates

New features, study tips and exam insights — straight to your inbox.

IB Diploma

  • IB Past Papers
  • IB Study Notes
  • IB Question Bank
  • IB Mock Exams
  • IB Revision

IB Subjects

  • IB Math AA
  • IB Math AI
  • IB Economics
  • IB Business Management
  • IB Physics
  • IB Biology
  • View all IB subjects→

IB Past Papers

  • IB Math AA HL Past Papers
  • IB Math AA SL Past Papers
  • IB Math AI HL Past Papers
  • IB Math AI SL Past Papers
  • IB Economics HL Past Papers
  • IB Economics SL Past Papers
  • IB ESS Past Papers
  • View all past papers→

Study Resources

  • Study Notes
  • Question Bank
  • Mock Exams
  • Crash Courses
  • Flashcards
  • Revision Guide
  • Exam Skills
  • Command Terms
  • Grade Calculator
  • Exam Timetable 2026

Aimnova

  • Features
  • Pricing
  • For Teachers
  • For Schools
  • For Parents
  • About Us
  • Blog
  • Contact
aımnova

IB study, practice and feedback built around the real exam.

TermsPrivacyCookies·© 2026 Aimnova. All rights reserved.c90f7ab

Aimnova is not affiliated with or endorsed by the International Baccalaureate Organization (IB).

NotesBiology HLTopic 2.6Oxygen dissociation curves as a means of representing the affinity of haemoglobin for oxygen
Back to Biology HL Topics
2.6.134 min read

Oxygen dissociation curves as a means of representing the affinity of haemoglobin for oxygen (Biology HL)

IB Biology · Unit 2

IB exam ready

Study like the top scorers do

Access a smart study planner, AI tutor, and exam vault — everything you need to hit your target grade.

Start Free

Contents

  1. 1Reading an oxygen dissociation curve
  2. 2Why the curve is S-shaped
  3. 3Exam-style question (step by step)
The big idea: An oxygen dissociation curve shows how saturated haemoglobin is at each partial pressure of oxygen: a picture of its affinity for oxygen.
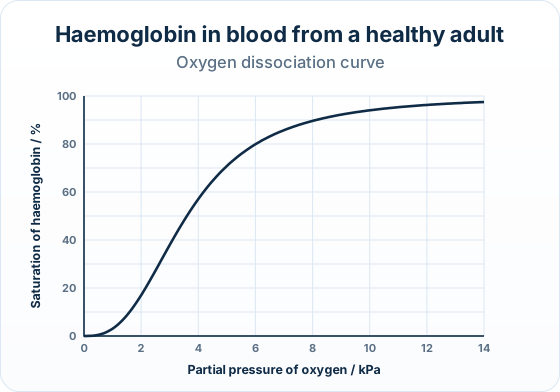
An oxygen dissociation curve of adult haemoglobin on a fine grid, saturation against partial pressure of oxygen in kPaAn oxygen dissociation curve of adult haemoglobin on a fine grid, saturation against partial pressure of oxygen in kPa
Read across from the curve to the saturation axis.

The points to remember

  • y axis: saturation of haemoglobin with oxygen (%); x axis: partial pressure of oxygen (kPa or mmHg).
  • To read a value: go up from the partial pressure to the curve, then across: at 5 kPa, about 71%.
  • Describe it in three points: saturation rises with partial pressure, the curve is S-shaped (sigmoid), and it levels off at high partial pressure.
Two traps: Give the unit: 71%, not 71.

'It reaches 100%' is not a description: the curve levels off just below full saturation.

Free preview

This is the free notes preview

You're reading the free notes. Aimnova Pro unlocks the full study experience — and you can try it with your first topic free to keep:

  • FlashcardsLock in vocabulary and key terms with spaced repetition.
  • Practice questionsAnswer exam-style questions and get instant AI marking.
  • Mock exams & past-paper vaultSit full mocks and see exactly how examiners award marks.
  • Personalised study planA daily plan built around your exam date and weak areas.
Start Studying Free Full access to Aimnova Pro · cancel anytime
The big idea: The curve is S-shaped because of cooperative binding: each oxygen that binds makes the next one bind more easily.

The points to remember

  • Flat start: at low partial pressure the first oxygen binds with difficulty (low affinity).
  • Steep middle: binding changes haemoglobin's shape, so the affinity rises and oxygen binds fast.
  • Plateau: almost every haem group is full, so little more can bind.
  • The steep part matches the partial pressures in respiring tissues: a small fall in partial pressure releases a lot of oxygen.
  • In the lungs (high partial pressure) haemoglobin loads; in the tissues (low) it unloads.
Remember it as: Slow start, fast middle, full at the top.
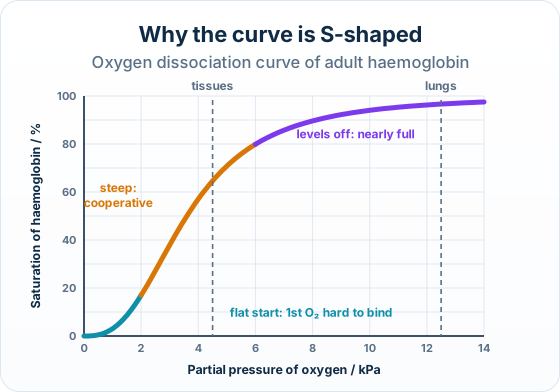
An S-shaped dissociation curve drawn in three coloured parts: a flat start where the first oxygen binds with difficulty, a steep middle labelled cooperative, a plateau labelled nearly full, with dashed lines for the tissues and the lungs
The S shape, part by part.

Know your predicted grade

Take timed mock exams and get detailed feedback on every answer. See exactly where you're losing marks.

Try Mock Exams FreeYour first topic is free to keep • No credit card required
How it is asked: Expect a curve to read and describe, or a 4-mark Outline of how haemoglobin's binding makes oxygen transport efficient.
IB-style questionDescribe[2 marks]

Describe the relationship between the partial pressure of oxygen and the percentage saturation of haemoglobin.

Model answer plan

See the answer broken into clear points, with guidance on how each point earns marks.

Claim your free topic

A longer question on the same idea:

IB-style questionOutline[4 marks]

Outline how reversible changes to haemoglobin molecules increase the efficiency of oxygen transport in the body.

Model answer plan

See the answer broken into clear points, with guidance on how each point earns marks.

Claim your free topic

IB Exam Questions on Oxygen dissociation curves as a means of representing the affinity of haemoglobin for oxygen

Practice with IB-style questions filtered to Topic 2.6.13. Get instant AI feedback on every answer.

Practice Topic 2.6.13 QuestionsBrowse All Biology HL Topics

How Oxygen dissociation curves as a means of representing the affinity of haemoglobin for oxygen Appears in IB Exams

Examiners use specific command terms when asking about this topic. Here's what to expect:

  • Define

    Give the precise meaning of key terms related to Oxygen dissociation curves as a means of representing the affinity of haemoglobin for oxygen.

    AO1
  • Describe

    Give a detailed account of processes or features in Oxygen dissociation curves as a means of representing the affinity of haemoglobin for oxygen.

    AO2
  • Explain

    Give reasons WHY — cause and effect within Oxygen dissociation curves as a means of representing the affinity of haemoglobin for oxygen.

    AO3
  • Evaluate

    Weigh strengths AND limitations of approaches in Oxygen dissociation curves as a means of representing the affinity of haemoglobin for oxygen.

    AO3
  • Discuss

    Present arguments FOR and AGAINST with a balanced conclusion.

    AO3

See the full IB Command Terms guide

Related Biology HL Topics

Continue learning with these related topics from the same unit:

2.1.1Chemical properties of carbon that allow diverse compounds2.1.2Production of macromolecules by condensation reactions2.1.3Digestion of polymers into monomers by hydrolysis reactions2.1.4Form and function of monosaccharides
View all Biology HL topics
Improve your exam techniqueCommand terms, paper structure, and mark-scheme tips for Biology HL
Previous2.6.12Bohr shiftNextArchived: emphysema and lung disease (withdrawn, not in the 2025 guide)2.6.99

9 practice questions on Oxygen dissociation curves as a means of representing the affinity of haemoglobin for oxygen

Students who practiced this topic on Aimnova scored 82% on average. Try free practice questions and get instant AI feedback.

Try 3 Free QuestionsView All Biology HL Topics