From village to city: Rural-urban migration is why most people now live in urban areas, and why that share keeps rising.
The points to remember
- Rural-urban migration: people moving from the countryside to towns and cities.
- Because of it, a greater proportion of people now live in urban rather than rural areas.
- The world's urban population overtook the rural population in 2007.
- The urban share is still increasing: about 58% in 2025.
- Most rural-urban migration is internal: within one country.
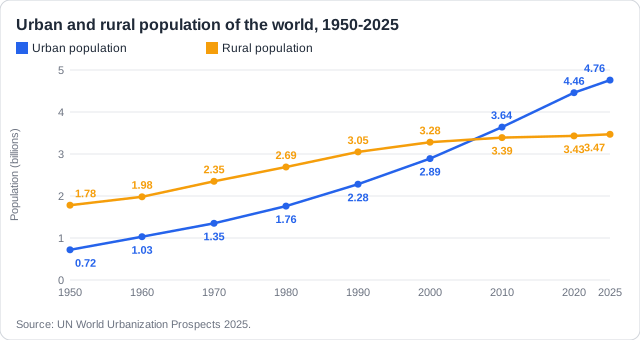
Real example: the world's urban population grew from 0.7 billion in 1950 to 4.8 billion in 2025, while the rural population only doubled. Most of the newcomers moved within their own country: from a Bangladeshi village to Dhaka, not to another country.
Free preview
This is the free notes preview
You're reading the free notes. Aimnova Pro unlocks the full study experience — and you can try it with your first topic free to keep:
- FlashcardsLock in vocabulary and key terms with spaced repetition.
- Practice questionsAnswer exam-style questions and get instant AI marking.
- Mock exams & past-paper vaultSit full mocks and see exactly how examiners award marks.
- Personalised study planA daily plan built around your exam date and weak areas.
People move because of what pushes them away from the countryside and what pulls them towards the city.
Push and pull factors
- Push factors drive people out of rural areas; pull factors draw them to cities.
- Push: few jobs, low farm incomes, mechanisation replacing farm workers.
- Push: drought, famine, crop failure, land degradation, conflict, poor services.
- Pull: jobs and higher wages, education, healthcare, better services and infrastructure.
- Pull: friends and relatives already there, social benefits, a perceived better life.
- Higher birth rates or lower death rates are not reasons for migration.
Push (leave rural)
- Few jobs, low farm incomes
- Mechanisation
- Drought, famine, land degradation
- Conflict, poor services
Pull (go to the city)
- Jobs, higher wages
- Schools, hospitals
- Friends and relatives
- A perceived better life
Real example: Dhaka's garment factories employ about 4 million workers, mostly young women from villages: a strong pull. In the countryside, floods and river-bank erosion destroy farms every year: a push.
Migration reasons only: Asked why a city's population grew through migration? Higher birth rates or lower death rates do not count: give push or pull factors.
Get feedback like a real examiner
Submit your answers and get instant feedback — what you did well, what's missing, and exactly what to write to score full marks.
Not every migrant chooses to move. The difference between forced and voluntary migration is choice.
Forced or voluntary
- Voluntary migration: people choose to move, usually for jobs or education.
- Forced migration: people have no choice: conflict, disaster, eviction, loss of land.
- Many moves mix both: a drought makes farming fail, so leaving is hardly a free choice.
- Governments can force moves too, for example to clear land for a dam.
Voluntary
- A choice
- For jobs, education, family
- Often planned
Forced
- No real choice
- Conflict, disaster, eviction
- Often sudden
Real example: in Bangladesh, a young woman who leaves her village for a factory job in Dhaka migrates voluntarily. A family whose land is washed away by river-bank erosion is forced to move, often to the city's informal settlements.
Remember it as: Voluntary = chose to go. Forced = had to go.
Migrants move for a better life. Some of what they expect is real; some is only perceived.
Perceived or real advantages
- Migrants move for the advantages they expect: jobs, wages, schools, hospitals, a better life.
- Some are real: on average city incomes, schooling and healthcare are better.
- Some are only perceived: many find informal jobs with low, insecure pay.
- Housing is often an informal settlement with poor water and sanitation.
- Many still send money home, so rural families gain too.
Expected
- A steady job
- A good home
- Schools and hospitals
Often found
- Informal, low-paid work
- A crowded informal settlement
- Services too few or too far
Real example: about a million people live in Dharavi, in Mumbai, on about 2 km². Its thousands of small workshops (recycling, pottery, leather) give real jobs, but many homes share toilets and drains flood in the monsoon.
Learn what examiners really want
See exactly what to write to score full marks. Our AI shows you model answers and the key phrases examiners look for.
Within one country, rural-urban migration follows a pattern over time, and in richer countries it can partly reverse.
The trend within a country, and deurbanization
- Within a country, rural-urban migration is fast at first, then slows once most people are urban.
- The rural population may fall for decades: rural depopulation.
- Deurbanization: people leave big cities for suburbs, small towns or the countryside.
- Reasons: jobs leaving the city, cheaper housing, more space, retirement, working from home.
- Depopulation rate = (start - end) ÷ start × 1000 (per 1000), or × 100 for %.
Calculate a depopulation rate: France's rural population fell from about 17.8 million (1960) to 14.6 million (1970). Rate = (17.8 - 14.6) ÷ 17.8 × 1000 = 180 per 1000 (18%). Never give a negative answer.
Real example: France's 'rural exodus' emptied villages in the 1950s and 1960s; since the 1970s its rural population has stayed at about 14 million. Detroit, USA, shows deurbanization: as car factories closed and families moved to the suburbs, it fell from 1.85 million people in 1950 to about 640,000 in 2020.
How this comes up: Paper 2, Section A: two views of a city years apart, then suggest two reasons for its growth [2] (May 2026).
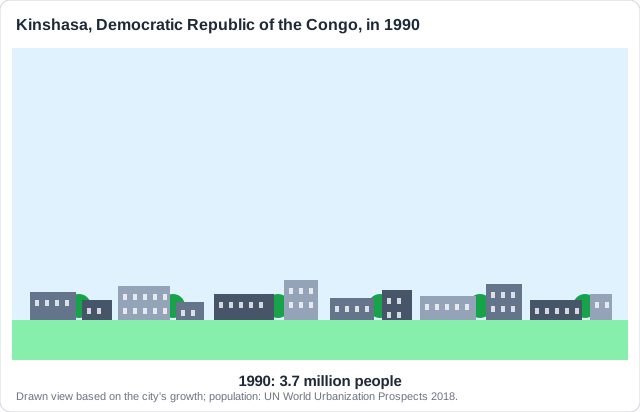
Figure 1 shows Kinshasa, Democratic Republic of the Congo, in 1990, when about 3.7 million people lived there. By 2020 about 14.3 million did, in a city of tall buildings and highways.
Suggest two reasons for the change in population in Kinshasa.
Model answer plan
See the mark-by-mark plan — for / against / judgement, with marking guidance — in study mode.