Births minus deaths: The natural increase rate shows how fast a population grows from births and deaths alone. It uses the crude birth rate and the crude death rate.
The points to remember
- Natural increase = births − deaths: it leaves out migration.
- As a rate: NIR = CBR − CDR, given per 1000 people.
- As a percentage: NIR (%) = (CBR − CDR) ÷ 10.
- From totals: (births − deaths) ÷ population × 100 gives the same %.
- NIR can be negative: a natural decrease, when deaths outnumber births.
- Always write the unit: % or per 1000. A bare '0.8' is not an answer.
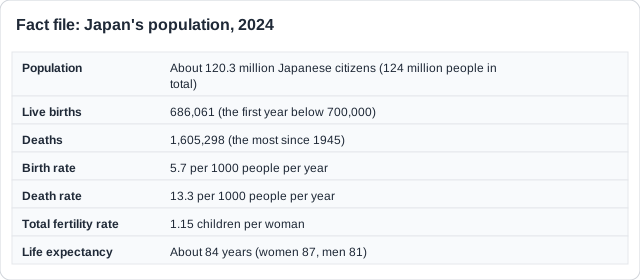
Worked example: two ways to the same answer: From the rates: NIR = (CBR − CDR) ÷ 10 = (5.7 − 13.3) ÷ 10 = −0.76% (or −7.6 per 1000).
From the totals: (686,061 − 1,605,298) ÷ 120,300,000 × 100 = −919,237 ÷ 120,300,000 × 100 = −0.76%.
Real example: Japan's natural decrease of 919,237 people in 2024 is like losing a city the size of Naples in one year.
Remember it as: Births minus deaths, divide by ten, add the % sign.
Free preview
This is the free notes preview
You're reading the free notes. Aimnova Pro unlocks the full study experience — and you can try it with your first topic free to keep:
- FlashcardsLock in vocabulary and key terms with spaced repetition.
- Practice questionsAnswer exam-style questions and get instant AI marking.
- Mock exams & past-paper vaultSit full mocks and see exactly how examiners award marks.
- Personalised study planA daily plan built around your exam date and weak areas.
A growth rate of 2% sounds small, but it doubles a population quickly. The doubling time turns a percentage into years, using the rule of 70.
Doubling time
- Doubling time = the number of years a population takes to double at its current growth rate.
- Rule of 70: doubling time = 70 ÷ growth rate (%).
- Use the growth rate as a %: if the NIR is given per 1000, divide by 10 first.
- If only birth and death rates are given, work out the NIR first: (CBR − CDR) ÷ 10.
- Faster growth = shorter doubling time. A shrinking population never doubles.
- Give the unit: years.
Worked example: Niger grows by about 3.3% a year.
DT = 70 ÷ growth rate = 70 ÷ 3.3 = 21 years. At that rate Niger's population doubles in about 21 years.
From birth and death rates: a country with CBR 16.17 and CDR 6.28 has NIR = (16.17 − 6.28) ÷ 10 = 0.989%, so DT = 70 ÷ 0.989 = 71 years.
| Growth rate | Doubling time |
|---|---|
| 0.5% | 140 years |
| 1% | 70 years |
| 2% | 35 years |
| 3.5% | 20 years |
Real example: Japan is shrinking (−0.76%), so it has no doubling time at all.
It is only an estimate: The rule of 70 assumes the growth rate stays the same. Births, deaths and migration change, so a doubling time is a forecast, not a fact.
Study smarter, not longer
Most students waste 40% of study time on topics they already know. Our AI tracks your progress and optimizes every minute.
The crude birth rate counts births for everyone, even men and grandparents. The total fertility rate counts children per woman, so it shows the future better.
Total fertility rate
- Total fertility rate (TFR) = the average number of children a woman would have in her lifetime.
- It counts births per woman of childbearing age, unlike the crude birth rate (per 1000 people).
- Replacement level is about 2.1: two children replace the parents, plus a little for children who die young.
- TFR below 2.1 for many years: in time the population falls and ages, unless immigrants arrive.
- TFR above 2.1: the population keeps growing.
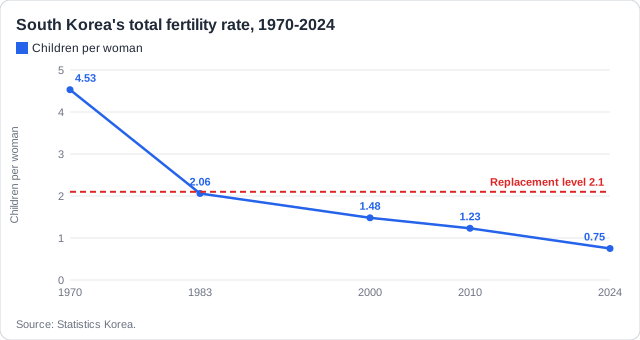
Real example: South Korea's TFR was 0.72 in 2023 and 0.75 in 2024, the lowest in the world. In Niger women have about six children each.
Per woman, not per 1000: TFR is about families, not the whole population: 'children per woman'. Size of the population does not come into it.
Life expectancy sums up how healthy and safe a place is.
Life expectancy
- Life expectancy = the average number of years a person can expect to live, usually from birth.
- It assumes today's death rates stay the same for the rest of their life.
- Higher with good healthcare, a healthy diet and enough income to afford it.
- Higher with clean water and sanitation, and less air pollution.
- Lower after wars, famines and pandemics.
Healthcare
- Japan: everyone is covered by health insurance and sees a doctor often.
Diet and income
- Japan: a diet rich in fish and vegetables, and incomes high enough to afford it.
Clean water and air
- Piped, treated water and sewers stop diseases like cholera.
Real example: Japan's life expectancy is about 84 years (women 87, men 81), against a world average of 73.3 (2024).
Give the reason, not a label: 'Better quality of life' alone is not enough. Say what is better: healthcare, diet, clean water, less pollution.
Practice with exam-style questions
Answer exam-style questions and get AI feedback that shows you exactly what examiners want to see in a full-marks response.
Papers ask for the similarities and differences between two measures. Learn what each one counts.
Comparing the measures
- All four measures are averages (mean values), usually for one year.
- CBR: births per 1000 of the whole population; a snapshot of one year.
- TFR: births per woman, over her lifetime; it allows for the age of the women.
- NIR: births and deaths; it can be negative; it shows growth better than CBR alone.
- DT: an estimate from the growth rate; it takes deaths into account, CBR does not.
- Together they let us compare populations and predict change.
| Measure | Counts | Unit | Can be negative? |
|---|---|---|---|
| Crude birth rate | Births in the whole population | Per 1000 per year | No |
| Total fertility rate | Children per woman, lifetime | Children per woman | No |
| Natural increase rate | Births minus deaths | % or per 1000 | Yes |
| Doubling time | Years to double | Years | No (none if shrinking) |
| Life expectancy | Average years lived | Years | No |
Real example: Japan, 2024: CBR 5.7 per 1000, TFR 1.15, NIR −0.76%, no doubling time, life expectancy about 84. Together they show a shrinking, ageing population.
How a [4] is marked: One mark per point: a definition, a similarity, a difference. Give both sides: only similarities or only differences caps the answer at [3].
Papers also hand you a graph, a map or a table of population data. Read it the same way every time.
How to read population data
- Describe the trend: rising, falling or steady, and when it changes.
- Give the rate of change: slow, rapid, exponential, slowing down.
- Quote numbers and years from the graph.
- A fall in the line = negative growth that year.
- Compare places or regions: which is highest, which is lowest.
- Population density = population ÷ area (people per km²).
Start
Iceland: no people before about 874, when settlers arrived.
Slow rise
About 50,000 people by 1703.
A fall
The Laki eruption of 1783 and famine killed about a fifth.
Rapid rise
Fast growth after 1900, to about 390,000 today.
Trend, rate, differences: When describing population data, state the trend (rising or falling), the rate of change, and any differences between places, with numbers.
Real example: describing Iceland's line in four steps, each with a date and a number, would earn the marks on a [2] 'describe the trends' question.
Feeling unprepared for exams?
Get a clear study plan, practice with real questions, and know exactly where you stand before exam day. No more guessing.
How this comes up: Calculate a natural increase rate or a doubling time from a fact file or table [1]; a crude death rate [1]; what a fertility rate means for the future [1]; why life expectancy is higher [1]; describe trends [2]; compare two measures, or outline demographic tools [4].
In 2024 Japan had a crude birth rate of 5.7 per 1000 and a natural increase rate of −0.76%.
Outline the similarities and differences between crude birth rate and natural increase rate.
Model answer plan
See the mark-by-mark plan — for / against / judgement, with marking guidance — in study mode.