More, and different, over time: The amount of waste a society makes, and what that waste is made of, does not stay the same.
Waste over time
- The volume of waste changes over time: the world made 2.01 billion tonnes in 2016.
- It is projected to reach 3.40 billion tonnes by 2050: about 70% more.
- The composition changes too: more plastic, packaging and e-waste than before.
- Plastic piles up: it does not biodegrade, so each year's plastic adds to the last.
- Percentage change = (new - old) / old x 100.
- Mean per year = total / number of years. Always give the unit.
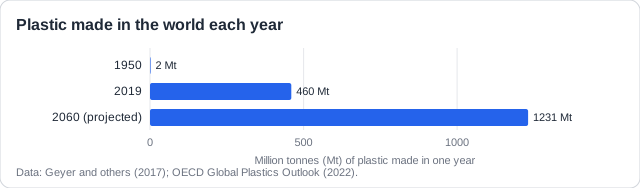
Real example: the world made about 2 million tonnes of plastic in 1950 and 460 million tonnes in 2019. Of all the plastic waste made up to 2015, only about 9% was recycled and 12% burnt; 79% piled up in landfills or the environment.
Remember it as: Over time: more waste, and more of it plastic.
Free preview
This is the free notes preview
You're reading the free notes. Aimnova Pro unlocks the full study experience — and you can try it with your first topic free to keep:
- FlashcardsLock in vocabulary and key terms with spaced repetition.
- Practice questionsAnswer exam-style questions and get instant AI marking.
- Mock exams & past-paper vaultSit full mocks and see exactly how examiners award marks.
- Personalised study planA daily plan built around your exam date and weak areas.
Waste also differs from one society to another, at the same moment in time: in its amount per person and in what it is made of.
Waste between societies
- Richer societies make more waste per person: North America 2.21 kg a day, Sub-Saharan Africa 0.46 kg.
- High-income countries have 16% of the world's people but make 34% of its waste.
- Poorer societies throw away more food and green waste: 56% (low income) v 32% (high income).
- Richer societies throw away more dry waste: paper, plastic, metal, glass (51% v 16%).
- Waste grows fastest where incomes, populations and cities are growing fastest.
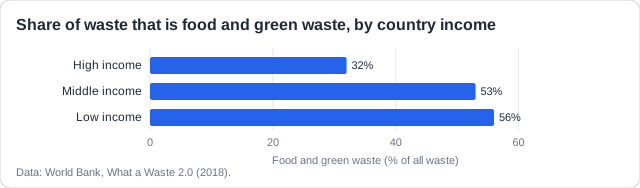
Real example: in low-income countries about 56% of waste is food and green waste, because people buy fresh food with little packaging; in high-income countries it is 32%, and paper, plastic, metal and glass make up about half.
See how examiners mark answers
Answer exam-style questions with model answers. Learn exactly what earns marks and what doesn't.
Four kinds of factor: The guide sorts the causes into four groups. Learn one real example of each.
The four factors
- Socio-economic: income, population growth, cities, shopping habits, tourism.
- Political: laws, taxes, bans, and how well they are enforced.
- Environmental: climate, seasons, disasters such as floods and storms.
- Technological: new products and gadgets, packaging, how goods are made and waste is measured.
- Name the factor, then link it to more or less waste, or a different mix.
| Factor | How it changes waste | Real example |
|---|---|---|
| Socio-economic | More income, more goods bought and thrown away | Sub-Saharan Africa: waste projected to nearly triple by 2050 |
| Political | A ban takes an item out of the waste | Kenya banned plastic carrier bags in 2017 |
| Environmental | A disaster makes sudden waste | Japan's 2011 tsunami washed about 5 million tonnes of debris into the sea |
| Technological | New gadgets become e-waste | E-waste rose from 34 to 62 million tonnes, 2010 to 2022 |
Real example: after Kenya banned plastic carrier bags in 2017, with fines for anyone making, selling or using them, the bags largely disappeared from its streets and waste: a political factor.
Societies also differ in what they do with their waste, and the papers test this with a bar chart of disposal methods by income.
Disposal varies with income
- Low-income countries dump most waste in the open: 93%.
- As incomes rise, landfills replace dumps: 54% of waste in upper-middle-income countries.
- In high-income countries landfill falls to 39%; incineration (22%) and recycling rise.
- Why: landfills and incinerators cost money; richer countries can afford them and the technology.
- Land is expensive in rich, crowded places, so waste is burnt or recycled instead of buried.
- Education and changing values push for greener methods.
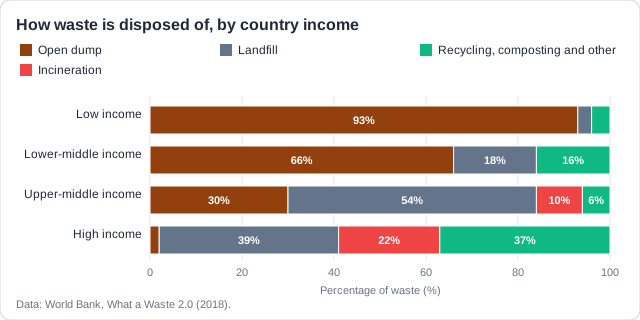
Up, then down: Landfill use rises from low to upper-middle income, then falls to high income. Describe both parts for both marks, and give reasons that fit the part you describe.
Real example: Singapore is rich but short of land, so it burns most of the waste it does not recycle and buries only the ash, on Semakau, an island landfill offshore.
Study smarter, not longer
Most students waste 40% of study time on topics they already know. Our AI tracks your progress and optimizes every minute.
Reading waste data: Most waste questions give you a graph or a table. These are the skills they test.
Reading waste data
- Describe a trend: its direction, numbers from the graph, and any change of direction.
- Estimate from a graph: read the axis carefully and give the unit.
- Plastic used does not decide plastic reaching the sea.
- What matters is collection: countries that collect and treat their waste leak little.
- Also rivers that carry waste, people living near the coast, and laws that are enforced.
- Waste data are often estimates: they may be inaccurate or biased.
Real example: a 2021 model estimated that the Philippines sends about 36% of all the plastic that rivers carry to the sea. People there use less plastic than in many rich countries, but much of it is not collected, and many rivers flow through crowded cities to the coast.
Same income, different waste: If two countries have the same income, income cannot explain their gap. Use laws, charges, campaigns, home composting, tourism, imported packaging or values instead.
How this comes up: Paper 2, Section A: a chart of waste over time, a calculation, then reasons for the trend.
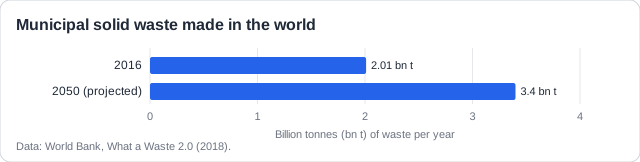
Figure 1 shows the world's municipal solid waste in 2016 and the amount projected for 2050.
Calculate the projected percentage increase in waste between 2016 and 2050.
Model answer plan
See the mark-by-mark plan — for / against / judgement, with marking guidance — in study mode.
The next part asks why. Each reason needs a factor and its link to more waste.
Outline two reasons for the projected trend shown in Figure 1.
Model answer plan
See the mark-by-mark plan — for / against / judgement, with marking guidance — in study mode.