A boundary that held: planetary boundaries are limits that keep the Earth in a safe state. For ozone, the limit is a small loss of the ozone layer. Thanks to the Montreal Protocol, the world has stayed inside it.
The points to remember
- Planetary boundaries mark a safe operating space for humanity; ozone depletion is one of nine.
- The ozone boundary is less than 5% below the pre-industrial level of 290 DU: about 276 DU.
- The global average was 284.6 DU in 2023: the boundary has not been crossed.
- The Antarctic hole dips far lower each spring, but that is regional and seasonal; the global average is safe.
- The reason: actions under the Montreal Protocol cut ODSs before ozone fell further.
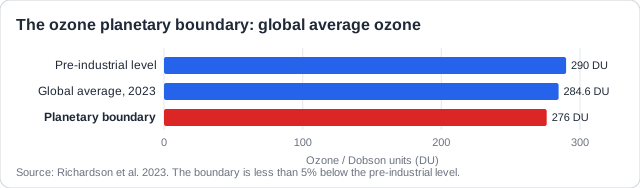
Real example: in 2023 a team led by Katherine Richardson checked all nine planetary boundaries. Six had been crossed, including climate change and biodiversity. Ozone was one of only three still in the safe zone, at 284.6 DU against a boundary of 276 DU.
Free preview
This is the free notes preview
You're reading the free notes. Aimnova Pro unlocks the full study experience — and you can try it with your first topic free to keep:
- FlashcardsLock in vocabulary and key terms with spaced repetition.
- Practice questionsAnswer exam-style questions and get instant AI marking.
- Mock exams & past-paper vaultSit full mocks and see exactly how examiners award marks.
- Personalised study planA daily plan built around your exam date and weak areas.
Papers give a graph of the ozone hole over time and ask you to describe it, or to read off a year. Learn the shape of the real record.
The points to remember
- Describe the direction, the years and the numbers: 'rose from 0.1 in 1979 to 23.6 million km² in 1994'.
- 1979 to the late 1980s: a rapid increase in the hole's area.
- 1990s to about 2006: large and fairly stable, peaking at 26.6 million km² in 2006.
- Since about 2000: fluctuating, with a slight overall decrease; very small in 2002 and 2019.
- Do not describe the projected part of a graph when asked about the recorded data.
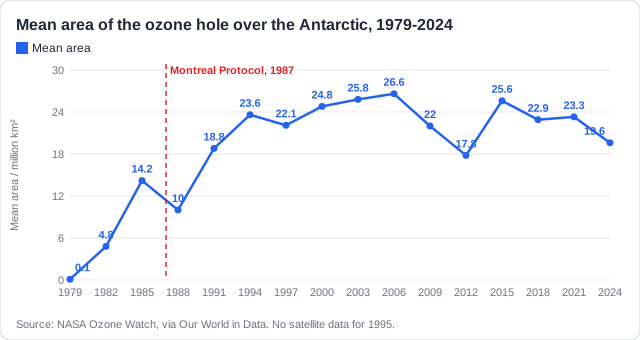
Remember it as: Up fast, flat at the top, slowly down.
Real example: the largest mean area was 26.6 million km² in 2006. In 2019 it was only 9.3 million km², the smallest since 1982, because a sudden warming of the stratosphere weakened the polar vortex that year.
Stop wasting time on topics you know
Our AI identifies your weak areas and focuses your study time where it matters. No more overstudying easy topics.
Did the Protocol work? Read the data: The guide asks you to use data on the ozone hole over time as evidence. Compare before and after 1987, and be honest about what the data do not yet show.
The points to remember
- The Protocol was signed in 1987: compare the data before and after.
- World ODS use fell by about 99%, from 1.66 million ODP tonnes (1989) to 17 thousand (2021).
- Chlorine in the stratosphere peaked in 1993 and has fallen since.
- The hole stopped growing in the late 1990s and has slowly begun to shrink: some success.
- But it has not returned to 1980 levels: long-lived ODSs (and a black market) cause a time lag.
- So the data support success, but the final judgement must wait for recovery.
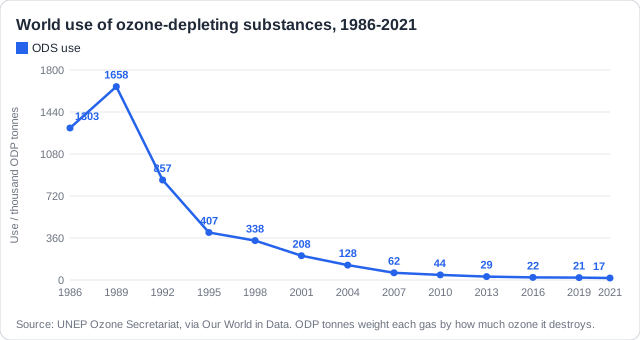
Real example: world use of ODSs, measured in ODP tonnes, fell from 1,658 thousand in 1989 to 17 thousand in 2021. The ozone hole kept growing until the late 1990s, then levelled off, which fits a cause with a long time lag.
Both sides: Say what supports success (the hole stopped growing) and what limits the judgement (no full recovery yet; a black market; long-lived ODSs).
Scientists use models to project when ozone will recover, and to imagine the world without the Protocol. Both support the conclusion that the boundary was protected.
The points to remember
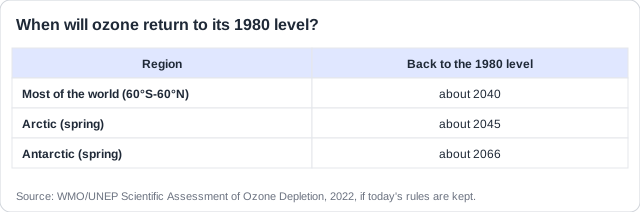
- Ozone should return to 1980 levels around 2040 for most of the world, 2045 in the Arctic, 2066 in the Antarctic.
- Why it recovers: CFCs banned, alternatives used, refrigerants recycled.
- Education changed what people buy, and international cooperation continues.
- Ozone re-forms naturally as the old ODSs slowly break down: the balance tips back.
- Projections are uncertain: models simplify, behaviour and illegal ODSs are hard to predict.
Real example: NASA scientists modelled a 'world avoided' with no Montreal Protocol (Newman, 2009). By 2065 about two-thirds of the world's ozone would have gone, and the midsummer UV index in cities such as Washington DC would have risen from about 10 to about 30, enough to burn skin in five minutes.
Reasons for the projected recovery: Two reasons, each a full sentence: what was done (the ban, alternatives, recycling, education) and why ozone comes back (ODSs break down, so ozone re-forms).
See how examiners mark answers
Answer exam-style questions with model answers. Learn exactly what earns marks and what doesn't.
How this comes up: Paper 2, Section A, on a graph of the ozone hole or of ozone over time: describe the trend [2], read the year of recovery [1], give two reasons for the projected change [2], or explain how the data judge the Montreal Protocol [4].
The mean area of the Antarctic ozone hole rose from 0.1 million km² in 1979 to 19.3 million km² in 1987, reached 26.6 million km² in 2006 and was 19.6 million km² in 2024.
Explain how these data can be used to judge the success of the Montreal Protocol.
Model answer plan
See the mark-by-mark plan — for / against / judgement, with marking guidance — in study mode.