Enough food, on paper: The world's farms grow enough food for all eight billion people. Hunger is not mainly a problem of too little food, but of who gets it and how much is lost or wasted.
The points to remember
- The world produces about 2,900 kcal per person per day; most people need about 2,100-2,500.
- So there is enough food for everyone, in total.
- But about a third of crops is fed to farm animals, and some becomes biofuel.
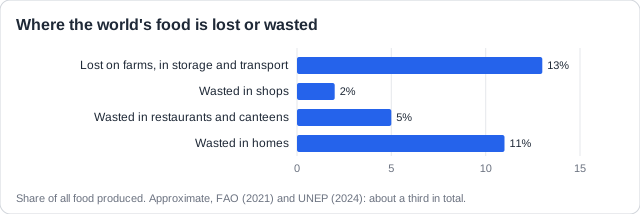
- At least one-third of all food is lost or wasted.
- And food goes to people who can pay for it, not always to those who need it.
Example (SL): maize in the USA. The USA grows more maize than any other country, but about a third of it is made into ethanol for cars, and much of the rest feeds cattle, pigs and chickens.
Free preview
This is the free notes preview
You're reading the free notes. Aimnova Pro unlocks the full study experience — and you can try it with your first topic free to keep:
- FlashcardsLock in vocabulary and key terms with spaced repetition.
- Practice questionsAnswer exam-style questions and get instant AI marking.
- Mock exams & past-paper vaultSit full mocks and see exactly how examiners award marks.
- Personalised study planA daily plan built around your exam date and weak areas.
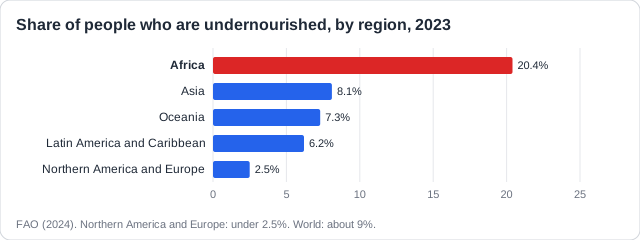
Food is not equitably distributed. In 2023 about 700 million people, about 1 in 11, were hungry, while over a billion were obese.
The points to remember
- Poverty: people who cannot afford food go hungry next to full shops.
- Conflict: war stops farming and blocks food deliveries.
- Poor roads and storage: food cannot reach the people who need it.
- Droughts and floods destroy harvests in the poorest places.
- Food for sale abroad: land grows crops for export, feed or fuel, not local meals.
Example (SL): the Democratic Republic of the Congo. The country has fertile soils and great rivers, yet about 25 million of its people faced severe food shortages in 2023, because fighting drove farmers from their land and roads are poor.
Learn what examiners really want
See exactly what to write to score full marks. Our AI shows you model answers and the key phrases examiners look for.
Food loss happens on farms, in storage and in transport. Food waste happens at the end of the chain.
The points to remember
- Poorer countries lose most food early: pests, no cold storage, heat, poor roads and machinery.
- Richer countries waste most food late: in shops and homes.
- Rich households buy too much, misread best-before dates and reject 'ugly' food.
- Poorer households waste less at home: they buy less, eat cheaper food and eat it all.
- So say more or less waste, at which stage, and why.
Example (SL): the UK. UK homes throw away about 6.4 million tonnes of food a year, most of it still good to eat: bread, potatoes and milk bought and never used.
The UN's Sustainable Development Goals include a target on food waste.
The points to remember
- SDG 12.3: by 2030, halve food waste per person at shop and consumer level.
- It also aims to reduce food losses on farms and in the supply chain.
- Less waste means less land, water and energy used for food no one eats.
- Wasted food in landfill also releases methane, a greenhouse gas.
Remember it as: Halve the waste by 2030: SDG 12.3.
Example (SL): France. A 2016 law stopped large supermarkets from throwing away or spoiling unsold food that is still good to eat; they must give it to food charities instead.
Never wonder what to study next
Get a personalized daily plan based on your exam date, progress, and weak areas. We'll tell you exactly what to review each day.
How this comes up: Paper 2 Section A shows food lost and wasted at each stage of a food system and asks you to identify the biggest stage [1] and describe a reason for a difference in another country [2].
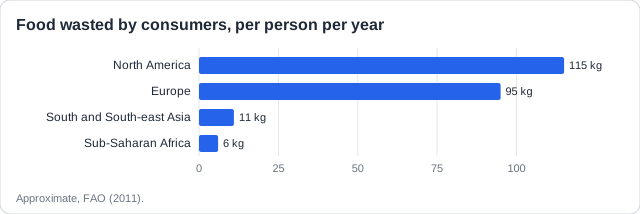
The bar chart shows the food wasted by consumers, per person per year, in four regions.
Describe one reason for the difference between consumer food waste in North America and in sub-Saharan Africa.
Model answer plan
See the mark-by-mark plan — for / against / judgement, with marking guidance — in study mode.