Pollution comes from many places: Water pollution has many sources, and it harms both freshwater (rivers, lakes) and the sea. The first question to ask about any source: does it come from one pipe, or from a whole landscape?
The points to remember
- A point source comes from one place you can find: a sewage pipe, a factory outfall, a drainage ditch.
- A non-point source comes from many, spread-out places: run-off from thousands of fields or streets.
- Point sources are easier to identify: you can trace the pollution back to the pipe.
- Point sources are easier to manage: treat or fine the one outfall.
- Non-point: farm fertiliser and pesticide run-off, soil from building sites, oil from streets.
- Always give a named example of each: without examples the most you can score is 3 of 4.
Point sources
- One place you can find
- A sewage pipe, a factory outfall, a drainage ditch, an oil spill
- Easier to identify and to regulate
- Can be treated before it reaches the river
Non-point sources
- Spread across the landscape
- Farm run-off, urban run-off, soil from building sites, air pollution
- Hard to trace and to regulate
- Needs action across the whole river basin
Remember it as: Point: one pipe, one fix. Non-point: a thousand fields, no single fix.
Real example: London's old sewers overflow into the River Thames at fixed pipes after heavy rain: point sources. Fertiliser washing off millions of fields into the Mississippi is a non-point source.
Free preview
This is the free notes preview
You're reading the free notes. Aimnova Pro unlocks the full study experience — and you can try it with your first topic free to keep:
- FlashcardsLock in vocabulary and key terms with spaced repetition.
- Practice questionsAnswer exam-style questions and get instant AI marking.
- Mock exams & past-paper vaultSit full mocks and see exactly how examiners award marks.
- Personalised study planA daily plan built around your exam date and weak areas.
The guide names six sources. Each adds different pollutants, so each has different impacts: pathogens make people ill, nutrients cause eutrophication, metals poison food chains.
The points to remember
- Sewage: human waste, so pathogens, organic matter and nutrients.
- Agricultural run-off: fertiliser (nitrates, phosphates), pesticides, manure, soil.
- Industrial effluent: heavy metals (mercury, lead), chemicals, warm water from power stations.
- Urban run-off: oil, tyre dust, metals and litter washed off roads and roofs when it rains.
- Solid waste disposal: plastics and rubbish dumped in rivers or blown into the sea.
- Oil spills: from tankers, pipelines and oil rigs; oil coats animals and shores.
| Source | Main impact | Real example |
|---|---|---|
| Sewage | Disease; low oxygen; algal blooms | London's Thames: sewer overflows; the 25 km Tideway 'super sewer' now catches them |
| Agricultural run-off | Eutrophication; poisoned wildlife; muddy water | The Mississippi carries farm fertiliser to the Gulf of Mexico |
| Industrial effluent | Toxic metals and chemicals; warm, low-oxygen water | Minamata Bay, Japan, 1950s: a factory's mercury poisoned fish and people |
| Urban run-off | Oil, metals and litter after every storm | After storms, oil and litter from streets flow down drains into rivers |
| Solid waste | Animals tangled or starved by plastic | Indonesia's Citarum river is choked with plastic and household rubbish |
| Oil spills | Coats birds, mammals and shores; kills shellfish | Exxon Valdez, Alaska, 1989: about 41 million litres of crude oil spilled |
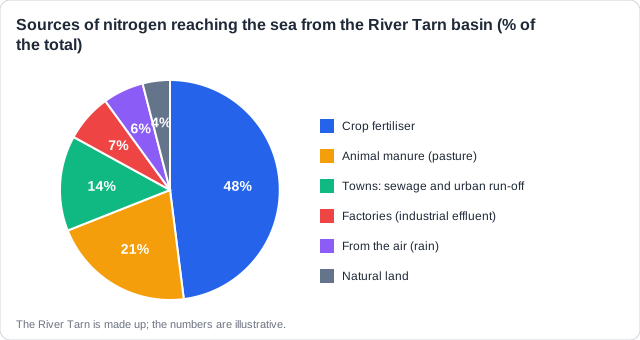
Reading a pie chart of sources: 'State the source with the highest contribution' wants the key's own words: 'crop fertiliser (48%)'. Check you are on the right pie: nitrogen and phosphorus often have different biggest sources. On a before and after chart, read the highest value of the 'after' series against the scale or key.
Stop wasting time on topics you know
Our AI identifies your weak areas and focuses your study time where it matters. No more overstudying easy topics.
The same waste can help or harm. Manure and compost feed the soil, but in a river they use up the oxygen. Biochemical oxygen demand (BOD) measures this.
The points to remember
- On land, manure or compost decomposes and slowly releases nitrates and phosphates: plants grow.
- The slow release means little washes away; it also improves soil structure, so less erosion.
- In water, the same waste is decomposed by bacteria that use up the dissolved oxygen (high BOD).
- Oxygen is scarce in water (not on land), so fish and insects suffocate.
- Its nutrients cause eutrophication; it makes water cloudy, cutting light for plants.
- Sewage and factory organic waste can also carry pathogens and toxins into drinking water.
On land: a fertiliser
- Decomposes slowly, releasing nitrates and phosphates
- Plants take them up as they grow
- Adds organic matter: better soil structure, less erosion
- Like natural leaf litter
In water: a pollutant
- Bacteria decompose it fast and use the oxygen
- Oxygen falls: fish and insects die
- Nutrients cause algal blooms
- Cloudy water cuts light; may carry pathogens
Remember it as: On land it feeds the plants; in water it eats the oxygen.
Real example: in Brittany, France, manure from large pig farms washes into rivers. Its nutrients feed green seaweed that piles up and rots on the beaches every summer.
Farming and clearing land are the biggest non-point sources. Each activity adds a pollutant, and each pollutant has its own effect on rivers, lakes and coastal seas.
The points to remember
- Fertiliser washes into rivers and seas: eutrophication, algal blooms, low oxygen.
- Manure and urine: nutrients, pathogens, and organic matter that lowers oxygen as it decomposes.
- Pesticides kill non-target fish and insects and bioaccumulate in food chains.
- Ploughing, overgrazing and trampled banks: soil erosion, so sediment clouds the water and smothers the bed.
- Irrigation takes water out: the river flows less, so pollution is less diluted.
- Clearing forest or mangroves: no roots to trap sediment and nutrients, so more reaches the reef.
- It also loses a carbon sink (warming, acidification) and lets floods of freshwater reach the sea (salinity).
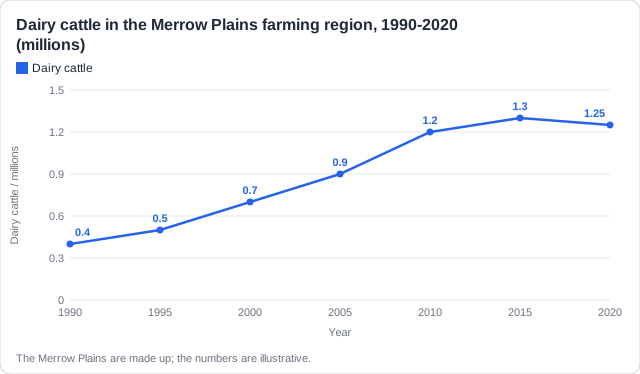
Link every point to the water: 'Soil erosion' alone is not enough: say the soil becomes sediment in the river that blocks light or smothers the bed. 'Pollutants' alone is not enough: name the pollutant and its effect.
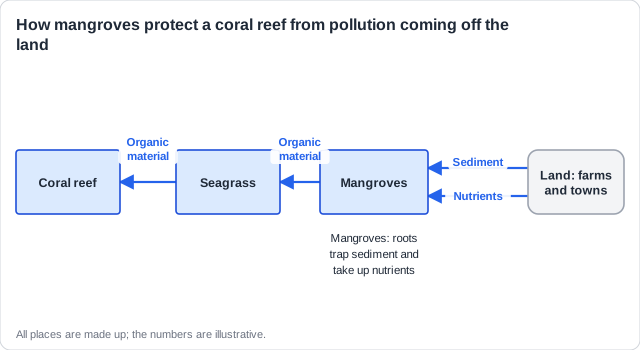
Real example: in the Coral Triangle (Indonesia, the Philippines), mangroves are cleared for shrimp ponds. Without their roots, more sediment and fertiliser reach the coral, which needs clear, nutrient-poor water.
See how examiners mark answers
Answer exam-style questions with model answers. Learn exactly what earns marks and what doesn't.
Some pollution is much harder to manage than a single pipe. Knowing why is worth marks, and so is knowing the three levels at which any pollutant can be tackled.
Why some pollution is hard to manage
- It is non-point: no single pipe to treat or fine.
- It comes from a huge area, across many states or countries: agreements are hard.
- Farming brings food and jobs, so governments are slow to restrict it.
- The damage is far from the source: polluters do not see it, or may not care.
- Cleaning up is expensive, and paying farmers to change can lack buy-in.
- Some pollutants are persistent: they never break down, and the open ocean belongs to no one.
Any pollutant can be tackled at three levels: stop the activity that makes it, stop it being released, or clean up what is already in the water.
Three levels of management
- Name the pollutant first (e.g. nitrate from fertiliser): without it the answer is capped.
- 1. Change the activity: use less fertiliser, slow-release fertiliser, phosphate-free detergents.
- Stops the pollutant at source and saves money; but can cut yields and behaviour is hard to change.
- 2. Stop the release: treat effluent, plant buffer strips of trees and grass along rivers.
- Stops the damage and adds habitat; but treatment costs money and rules need enforcing.
- 3. Clean up: dredge nutrient-rich mud, restock fish, lime acid lakes. Restores life but is costly and slow.
Real example: the Mississippi drains all or part of 31 US states and two Canadian provinces. Most of its nitrate comes from farms far upstream, so the dead zone in the Gulf of Mexico returns every summer.
Evaluate means both sides: For each strategy: name it, give two advantages, give two disadvantages. Then a one-line judgement.
Pollution affects the food we grow and catch. In a 'to what extent' answer, show the harm AND how far management limits it. Write about pollution harming food, not food production causing pollution.
The points to remember
- Fisheries: low-oxygen dead zones drive fish and shrimp away; catches fall.
- Aquaculture: algal blooms and pathogens kill farmed fish and close shellfish beds.
- Toxins such as mercury build up in fish, so they are unsafe to eat.
- On land, acid deposition and ozone damage crops; polluted irrigation water contaminates them.
- But food systems can recover when pollution is controlled: laws, treatment works and clean-ups help.
- Judge the extent: say which food systems suffer most, and how far management limits the harm.
Harm to food
- Dead zones push fish and shrimp away
- Toxins make fish unsafe to eat
- Algal blooms close shellfish farms
- Acid rain and ozone cut crop yields
Limits to the harm
- Laws and treatment works cut pollution
- Rivers and fish stocks can recover
- Monitoring closes fisheries before food is eaten
- Not all food systems are affected
Real example: shrimp boats in the Gulf of Mexico must travel further out each summer to avoid the dead zone. At Minamata, Japan, people who ate mercury-poisoned fish suffered nerve damage.
Study smarter, not longer
Most students waste 40% of study time on topics they already know. Our AI tracks your progress and optimizes every minute.
The guide asks for ONE example in detail: where it is, the source, the impacts on the environment, and the management. Learn these four headings with real facts.
The four headings
- Location: name the river, lake or sea and the country.
- Source: name the pollutant and where it comes from.
- Impacts: on wildlife, water quality and people.
- Management: what was done, and how well it worked.
Remember it as: Where, what, so what, now what.
Location
- The Ganges flows about 2500 km from the Himalayas to the Bay of Bengal
- Over 400 million people live in its basin; cities include Kanpur and Varanasi
Sources
- Untreated sewage from towns and cities along the banks
- Effluent from leather tanneries in Kanpur, carrying chromium (a heavy metal)
- Fertiliser run-off from farms; ashes and offerings from religious rituals
Impacts
- Faecal bacteria far above safe bathing levels in many stretches
- Waterborne diseases such as cholera and diarrhoea in people who use the water
- Low oxygen and toxins harm fish and the endangered Ganges river dolphin
Management
- Ganga Action Plan (1985): the first sewage treatment works on the river
- Namami Gange (2014): more treatment works, river-front clean-ups, rules for tanneries
- Limits: many works run below capacity and new sewage keeps growing
Use it in a long answer: The Ganges shows several sources at once (sewage, industry, farms) and why management is slow: the basin is huge and the sewage keeps growing.
How this comes up: Paper 2, Section B (a): distinguish between point and non-point sources, with named examples [4].
London's sewers overflow into the River Thames after heavy rain, while fertiliser washes into the Mississippi from millions of fields across the United States.
With reference to named examples, distinguish between point and non-point sources of water pollution.
Model answer plan
See the mark-by-mark plan — for / against / judgement, with marking guidance — in study mode.