Every water body has a budget: A lake, a reservoir, an aquifer or a whole drainage basin gains water from inputs and loses it through outputs, like a bank account with money in and money out.
The points to remember
- Any water body (a lake, a reservoir, an aquifer, a drainage basin) is an open system.
- Inputs: precipitation, rivers flowing in, groundwater seeping in, meltwater.
- Outputs: evaporation, rivers flowing out, seepage, and abstraction by people.
- Draw it as a flow diagram: the water body in a box, inputs and outputs as labelled arrows.
Remember it as: Water in, water out, and a store in between.
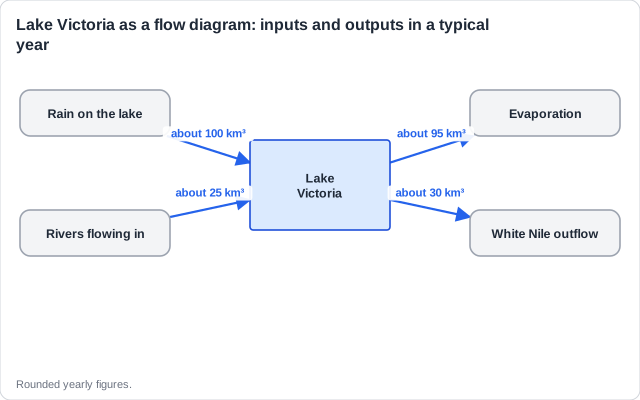
Real example: Lake Victoria, shared by Uganda, Kenya and Tanzania, gets most of its water as rain falling straight onto it, and loses most by evaporation. Its one outflow, at Jinja in Uganda, is the start of the White Nile.
Free preview
This is the free notes preview
You're reading the free notes. Aimnova Pro unlocks the full study experience — and you can try it with your first topic free to keep:
- FlashcardsLock in vocabulary and key terms with spaced repetition.
- Practice questionsAnswer exam-style questions and get instant AI marking.
- Mock exams & past-paper vaultSit full mocks and see exactly how examiners award marks.
- Personalised study planA daily plan built around your exam date and weak areas.
When a water body's inputs and outputs balance over the years, it is in steady state. Its level rises and falls with the seasons, but always comes back.
The points to remember
- In a steady state, inputs equal outputs, so the store stays about the same.
- It still goes up and down with the seasons, around a steady average.
- If outputs are bigger than inputs for years, the store shrinks.
- Reasons a reservoir varies: seasonal rainfall (input) and seasonal extraction (output).
Steady state
- Inputs = outputs over the years
- Level goes up and down, then back
- Sustainable
Not steady
- Outputs > inputs year after year
- Level keeps falling
- Unsustainable
Real example: Lake Victoria's level has stayed within a couple of metres for centuries: rain and rivers balance evaporation and the Nile, so it is close to a steady state.
'Less rain' is not enough: Say it is a seasonal or changing input or output: 'storage falls in the dry summer because rainfall input stops while the city keeps extracting water'.
Practice with exam-style questions
Answer exam-style questions and get AI feedback that shows you exactly what examiners want to see in a full-marks response.
The flow diagram turns into a sum. One formula answers every water-budget question.
The water-budget formula
- Formula: change in storage = total inputs - total outputs.
- Add up all the inputs; add up all the outputs; subtract.
- Zero: steady state. Positive: the store grows. Negative: it shrinks.
- Keep the units the whole way through (km³, million m³, mm).
Add the inputs
Rain 100 km³ + rivers 25 km³ = 125 km³.
Add the outputs
Evaporation 95 km³ + Nile 30 km³ = 125 km³.
Subtract
125 - 125 = 0 km³ a year.
Say what it means
No change: Lake Victoria is in a steady state.
Real example: the numbers above are Lake Victoria's rounded yearly budget. If people took an extra 10 km³ a year for farms and cities, the change would be 125 - 135 = -10 km³: the lake would start to shrink.
The same budget tells us how much water people can take for ever without the store running down: the sustainable rate of harvesting.
The points to remember
- A sustainable harvest takes no more than the store gains each year, so it never shrinks.
- Lake or reservoir: harvest at most inputs - the outputs that must continue (evaporation, rivers, wildlife).
- Aquifer: pumping at most the yearly recharge, minus what springs and rivers need.
- Deep aquifers refill over thousands of years: on a human timescale their water is non-renewable.
- Pump faster than recharge and the water table falls: wells must go deeper, and springs dry up.
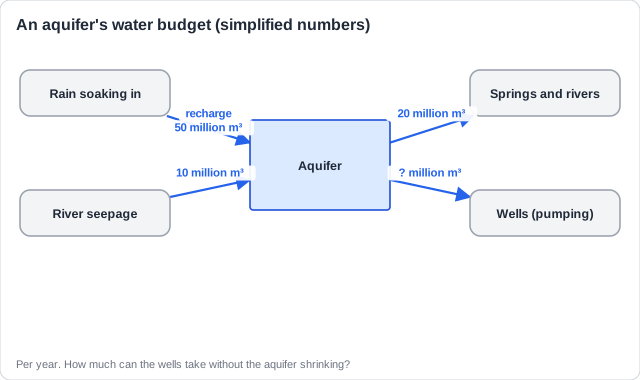
Worked example: the most the wells can take: Formula: sustainable pumping = inputs - outputs that must continue.
Inputs = 50 + 10 = 60 million m³. Springs and rivers need 20 million m³. Sustainable pumping = 60 - 20 = 40 million m³ a year.
Real example: the Ogallala aquifer under the US Great Plains waters a fifth of the country's wheat, corn and cattle. In parts of Kansas and Texas, farmers have pumped far faster than the recharge, under 2.5 cm a year, and the water table has fallen by over 45 m.
Feeling unprepared for exams?
Get a clear study plan, practice with real questions, and know exactly where you stand before exam day. No more guessing.
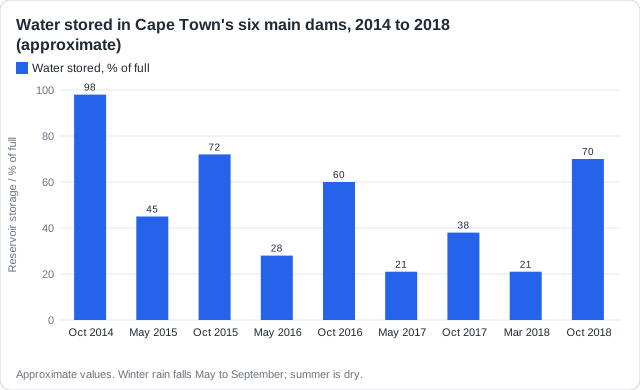
Reservoirs are managed with the same budget. A graph of how full they are shows the inputs and outputs changing with the seasons.
Input changes
- Winter rain refills the dams.
- In 2015-2017 the winters were very dry.
Output changes
- Summer irrigation and city use empty them.
- Evaporation is highest in hot summers.
What the city did
- Use cut from about 1,200 to 500 million litres a day.
- Day Zero, when taps would be shut, was avoided.
Real example: in early 2018, with Cape Town's dams near 20% full, the city warned of 'Day Zero'. Each person was limited to 50 litres a day; outputs fell so much that the winter rains could refill the dams.
How this comes up: Paper 2, Section A: a flow diagram of a lake. Calculate the change in storage [1], then say whether it is in a steady state [1].
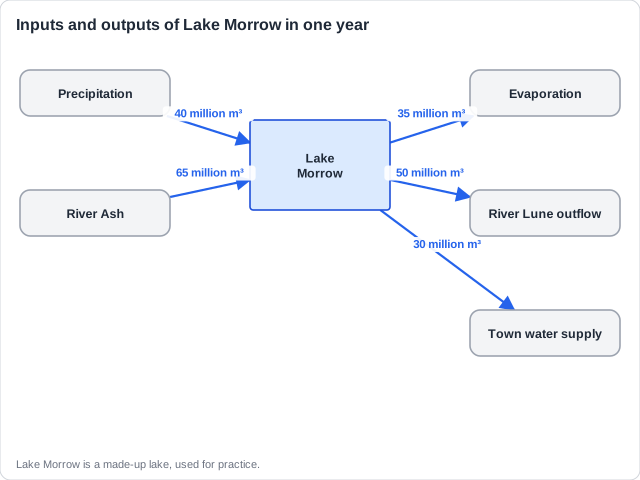
Figure 1 shows the inputs and outputs of Lake Morrow in one year.
(a) Calculate the change in the volume of water stored in Lake Morrow in that year.
(b) State whether the lake is in a steady state, giving a reason.
Model answer plan
See the mark-by-mark plan — for / against / judgement, with marking guidance — in study mode.