Simpson's reciprocal index puts richness and evenness into one number, D. It lets you compare two ecosystems, or one ecosystem over time.
The formula: D = N(N − 1) ÷ Σn(n − 1)
What each symbol means
- N = the total number of individuals of all species.
- n = the number of individuals of one species.
- Σ means add up: work out n(n − 1) for every species, then add them.
- A higher D means more diversity: more species (richness), more similar numbers (evenness).
- The lowest possible D is 1: a sample with only one species.
Worked example 1: one species dominates: A sample on the school field has 9 daisies and 1 buttercup, so N = 10.
D = (10 × 9) ÷ [(9 × 8) + (1 × 0)] = 90 ÷ 72 = 1.25.
D is low, close to 1: there are two species, but almost every plant is a daisy.
Remember it as: Everyone on top, each species underneath: N(N − 1) over the sum of n(n − 1).
Free preview
This is the free notes preview
You're reading the free notes. Aimnova Pro unlocks the full study experience — and you can try it with your first topic free to keep:
- FlashcardsLock in vocabulary and key terms with spaced repetition.
- Practice questionsAnswer exam-style questions and get instant AI marking.
- Mock exams & past-paper vaultSit full mocks and see exactly how examiners award marks.
- Personalised study planA daily plan built around your exam date and weak areas.
Use the same five steps every time, and show the working: the first mark goes for putting the numbers into the formula, and the answer alone may not earn both marks.
Five steps
- Write the formula first: D = N(N − 1) ÷ Σn(n − 1).
- Add every species to get N, then work out N(N − 1).
- For each species, work out n(n − 1). A species with 1 individual gives 0.
- Add these up to get Σn(n − 1).
- Divide the top by the bottom and give D to 2 decimal places.
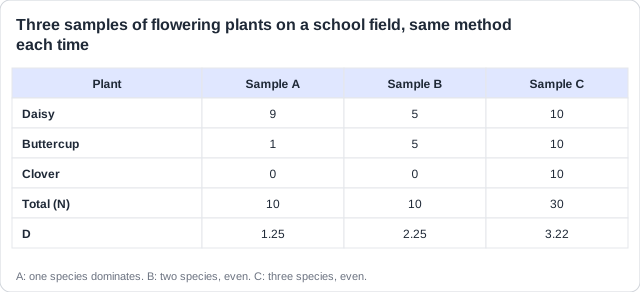
Worked example: sample C: Three species, 10 of each, so N = 30.
D = (30 × 29) ÷ [(10 × 9) + (10 × 9) + (10 × 9)] = 870 ÷ 270 = 3.22.
Uneven: sample A
- 9 daisies, 1 buttercup
- N = 10
- D = 1.25: one species dominates
Even: sample B
- 5 daisies, 5 buttercups
- N = 10
- D = 2.25: higher, same total
What D tells you: Same N, but more even numbers: higher D. More species, all even: higher still.
D is never below 1. A perfectly even sample scores a little above its number of species.
Practice with exam-style questions
Answer exam-style questions and get AI feedback that shows you exactly what examiners want to see in a full-marks response.
Sample both areas the same way: You cannot count every organism, so you sample each area in exactly the same way, then calculate D for each and compare.
The method
- Choose sample points at random (a grid and random numbers) or systematically along a transect.
- Fit the method to the organism: quadrats (plants), pitfall traps (ground animals), kick sampling (river animals), soil samples.
- Take several samples at each site and pool them.
- Count the individuals of each species. Identify them with a key, or just tell them apart (A, B, C).
- Standardise: same quadrat size, effort, time of day and season at both sites.
- Return the animals, then calculate D for each site: the higher D, the more diverse.
Real example: volunteers in the UK's Riverfly Partnership take a 3-minute kick sample at the same spots every month, so their samples can be compared.
What makes it less accurate
- Sample points not chosen at random: the sample is biased.
- Too few samples, or samples of the wrong size or in the wrong place.
- Misidentification: look-alike species and young stages.
- The two sites sampled on different days, at different times or in different seasons.
- Small, fast or burrowing animals are easily missed.
Not the Lincoln index: The Lincoln index estimates the size of one population. It does not measure diversity, so do not use it in a diversity question.
D turns a survey into a number that can be compared: two ecosystems, or one ecosystem over time.
Why it is measured
- Compare different ecosystems objectively, with one number each.
- Monitor change in one ecosystem over time: is diversity rising or falling?
- Spot ecosystems under threat, and judge whether conservation is working.
Studying a human impact: To show that an activity (a mine, a road, a quarry) changed biodiversity, design the study so the activity is the only difference.
The techniques, and why
- Sample before and after the activity, or near and far from it, so change is linked to it, not to disease or weather.
- Run a transect away from the source (a mine, a road) to see change with distance and edge effects.
- Use random or systematic quadrats in affected and unaffected areas; record abundance or percentage cover.
- Repeat over time and distance for reliability.
- Measure abiotic factors too (pH, light, temperature): the activity may have changed them.
- Use indicator species and D, which combines richness and evenness, so sites can be compared.
Real example: the Park Grass Experiment has been surveyed for over 150 years. Plots given nitrogen fertiliser now hold far fewer plant species than unfertilised plots: change over time, and its cause.
In a [7] answer: Name the ecosystem, and give the purpose of each technique, not just its name. Mobile animals are counted by mark-recapture: that gives one population, not diversity.
Feeling unprepared for exams?
Get a clear study plan, practice with real questions, and know exactly where you stand before exam day. No more guessing.
How this comes up: Calculate D from a table [2]; outline how diversity is measured [4]; describe a sampling method, or a factor that lowers its accuracy [1-4]; describe methods along a river [7]; explain techniques to study a human impact on a named ecosystem [7].
A student sampled invertebrates in a 1 m² quadrat on a coastal sand dune. She counted 30 sand-hoppers, 10 velvet mites, 20 ground beetles, 15 rove beetles and 25 springtails (N = 100).
Calculate Simpson's reciprocal index (D) for the quadrat, using D = N(N − 1) ÷ Σn(n − 1). Show your working.
Model answer plan
See the mark-by-mark plan — for / against / judgement, with marking guidance — in study mode.
Where marks are lost: With no working, the answer earns [1] at most. Put the numbers into the formula first.