Sample along the change: To see zonation, you sample across it. A transect records the living things AND the abiotic factors at the same points, so you can find what controls where each species lives.
The points to remember
- A transect is laid along the gradient, from one end to the other.
- Samples are taken at points along it: biotic data (which species, how many).
- Abiotic factors are measured at the same points.
- Comparing the two shows which variables affect the distribution of each species.
- A line transect records what touches the line; a belt transect uses quadrats along it.
Remember it as: Lay the line, sample the points, measure the conditions, match them up.
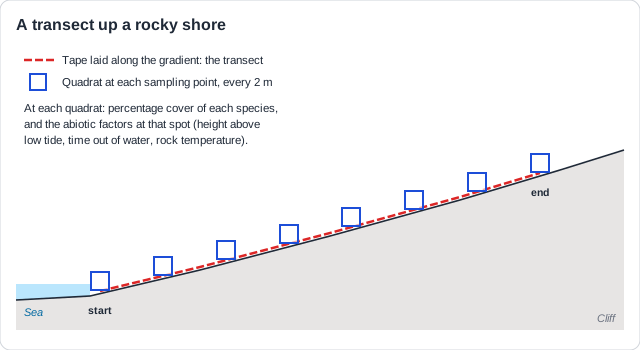
Real example: at Wembury Bay in Devon, England, a rocky shore protected as a marine conservation area, school groups lay a tape from the low-tide mark up to the cliff to see how the seaweeds change up the shore.
Free preview
This is the free notes preview
You're reading the free notes. Aimnova Pro unlocks the full study experience — and you can try it with your first topic free to keep:
- FlashcardsLock in vocabulary and key terms with spaced repetition.
- Practice questionsAnswer exam-style questions and get instant AI marking.
- Mock exams & past-paper vaultSit full mocks and see exactly how examiners award marks.
- Personalised study planA daily plan built around your exam date and weak areas.
Along the tape you sample at fixed steps, usually with a quadrat. The steps must be close enough to catch every zone: short steps on a steep shore, longer ones across wide dunes.
The points to remember
- Mark sampling points at regular intervals along the tape (systematic sampling).
- Place a quadrat at each point; name each species with an identification key.
- Record percentage cover (seaweeds, plants) or the number of individuals (limpets, snails).
- Or percentage frequency: the share of the quadrat's small squares that hold the species.
- Repeat with parallel transects and work out the mean for each point: more reliable data.
Percentage cover
- How much of the quadrat the species covers
- Best for seaweeds, grasses, lichens
- e.g. bladder wrack covers 60% of the square
Percentage frequency
- How many of the 100 small squares hold it
- Quick for plants that are hard to count
- e.g. marram grass is in 36 of 100 squares: 36%
Real example: at Wembury, a class places a 0.5 m quadrat every 2 m up the shore, repeats this on three transects 5 m apart, and takes the mean cover at each distance.
Say why each step matters: Regular intervals: no zone is missed. Parallel transects and means: one odd quadrat does not decide the result. The same quadrat size everywhere: the samples can be compared.
Memorize terms 3x faster
Smart flashcards show you cards right before you forget them. Perfect for definitions and key concepts.
The point of a transect is to explain the zones, so at every sampling point you also measure the abiotic factors that could control them, with the same care: the same time of day, repeated readings.
The points to remember
- Choose factors that change along the gradient and could limit the species.
- Shore: height above low tide, time out of water, rock temperature, salinity, wave exposure.
- Dunes: wind speed, soil moisture, soil pH, organic matter, light, temperature.
- Mountain: altitude, air temperature, soil depth, wind speed; data loggers record all day.
- Where a species' kite begins or ends at the same place a factor changes, that factor may limit it.
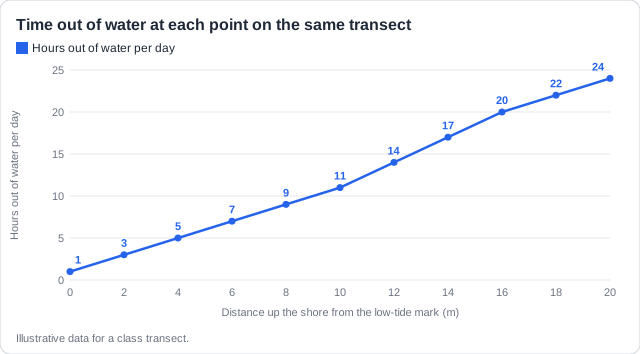
Real example: on the Wembury transect, serrated wrack is most common at 2 m, where the rock is out of the water for only about 3 hours a day. Channelled wrack is most common at 14 m, out of the water for about 17 hours a day.
A link is not proof: Several factors change together along a gradient, so a match between a kite and one factor shows the factor MAY limit the species, not that it does. Competition can set an edge too.
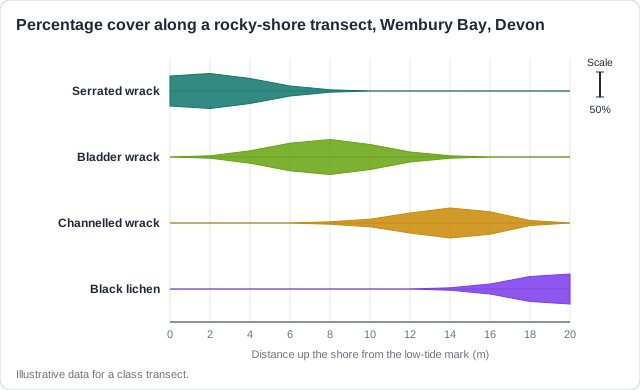
Transect data are shown in a kite diagram. Each species gets a band along the transect: wide where it is common, a thin line where it is absent.
The points to remember
- The horizontal axis is the transect: distance along it, or each sampling point.
- Each species has its own kite, drawn around its own line.
- The width at a point shows how common the species is there; read it with the scale.
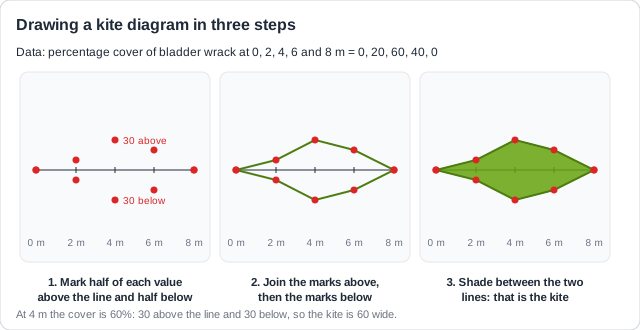
- To draw it, plot each value both above and below the line, half on each side.
- Join the points above, then the points below, and shade between the two lines.
To draw one yourself, work one species at a time, from a table of the mean values at each point:
Describe a kite with numbers: Give where it starts, where it peaks and where it ends: 'bladder wrack is found from 2 to 14 m and is widest, about 70% cover, at 8 m.'
Know your predicted grade
Take timed mock exams and get detailed feedback on every answer. See exactly where you're losing marks.
How this comes up: Paper 2, Section B (b): explain how transect data are collected and turned into a kite diagram [7].
A class wants to show how bladder wrack is distributed up a rocky shore at Wembury Bay, Devon.
Explain how data can be collected and manipulated to produce a kite diagram of the distribution of bladder wrack along the shore.
Model answer plan
See the mark-by-mark plan — for / against / judgement, with marking guidance — in study mode.