Many chains, joined up: Real ecosystems are more complex than a single food chain. A food web shows how the organisms in a community are linked through many feeding relationships.
The points to remember
- A food web is a network of interconnected food chains.
- Most species eat more than one kind of food and are eaten by more than one predator.
- So energy can move along several pathways, not one straight line.
- That makes a food web a more realistic model of a real community than a single food chain.
Remember it as: A chain is one path; a web is the whole map.
| Food chain | Food web | |
|---|---|---|
| Shape | One straight line | A network of many chains |
| Feeding links | Each species eats one food | Species eat, and are eaten by, several others |
| Energy | One pathway | Several pathways |
| How realistic | Simplified | Closer to a real community |
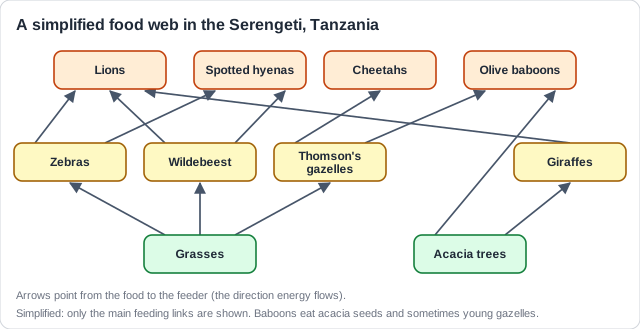
Real example: in the Serengeti, Tanzania, about 1.3 million wildebeest graze the grasslands. Lions and spotted hyenas eat both wildebeest and zebras, so each predator sits in several food chains at once.
Free preview
This is the free notes preview
You're reading the free notes. Aimnova Pro unlocks the full study experience — and you can try it with your first topic free to keep:
- FlashcardsLock in vocabulary and key terms with spaced repetition.
- Practice questionsAnswer exam-style questions and get instant AI marking.
- Mock exams & past-paper vaultSit full mocks and see exactly how examiners award marks.
- Personalised study planA daily plan built around your exam date and weak areas.
An arrow in a food chain or food web is not decoration: it shows where the energy and the matter go. When an animal eats, the biomass of its food becomes part of its own body.
The points to remember
- Each arrow shows the direction of energy flow and the transfer of biomass.
- The arrow points from the food to the feeder: read it as 'is eaten by'.
- The producers have no arrows pointing into them.
- Never draw the sun or light in a food chain or web: start with a producer.
Remember it as: Arrow = 'is eaten by': food first, feeder at the point.
Real example: in the Serengeti web, the arrow grasses → wildebeest means energy and biomass pass from the grass into the wildebeest; the arrow wildebeest → lion carries them on to the lions.
Three traps with arrows: Arrows pointing from the eater to the food lose the mark. Adding the sun at the start is wrong: a food chain starts with a producer. Extra arrows for heat, waste or respiration are not feeding links, so leave them out. (How a single chain carries energy: see 2.2.11.)
Know your predicted grade
Take timed mock exams and get detailed feedback on every answer. See exactly where you're losing marks.
In a food chain each species has one trophic level. In a food web a species can sit at two or more levels at once, because it eats foods from different levels.
The points to remember
- In a food web a species may feed at more than one trophic level.
- Count its level along each chain it is in: level = number of steps from the producer + 1.
- To take a food chain out of a web: start at a producer, follow the arrows up, one species per level.
- Use the names in the figure ('Arctic cod', not 'fish'; 'maple', not 'trees').
- Check the number of levels the question asks for, and draw every arrow to the eater.
Remember it as: Count the steps from the producer on each path.
Real example: in the Serengeti web, olive baboons eat acacia seeds (level 2) and young Thomson's gazelles (level 3). A three-level chain from the web: grasses → Thomson's gazelles → cheetahs.
Why webs rarely go above five levels: So much energy is lost at each step that few food chains have more than four or five levels: see 2.2.14.
A common task is to turn a table of 'what eats what' into a food web. Work in the same order every time.
Building a food web, step by step
- Put the producers at the bottom: the organisms that make their own food.
- Place each consumer one row above its highest food.
- Draw one arrow for each 'eats' in the data, from the food to the feeder.
- Give every box the species name from the data.
- Draw only feeding arrows: no sun, no arrows for waste, heat or respiration.
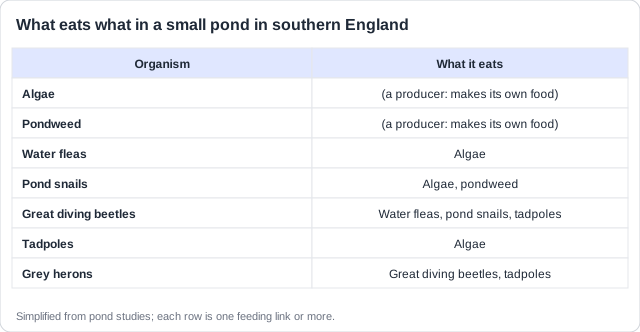
Check your web: Count the 'eats' in the table and the arrows in your web: the numbers must match. Name every species; 'plants' or 'vegetation' is not enough.
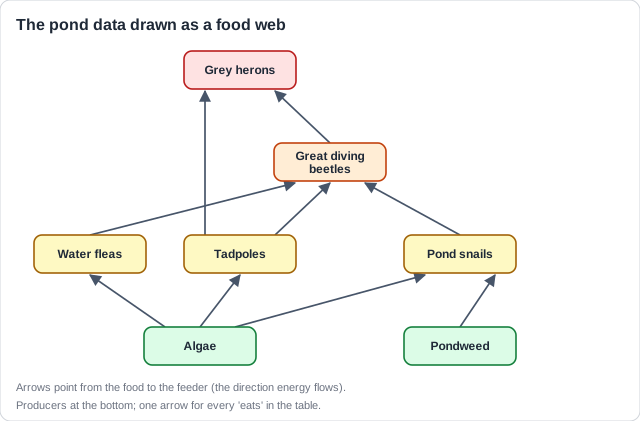
Real example: in a garden pond, the grey heron eats great diving beetles (level 4 there) and tadpoles (level 3), so the finished web shows it at two levels.
Get feedback like a real examiner
Submit your answers and get instant feedback — what you did well, what's missing, and exactly what to write to score full marks.
Questions often ask what happens to the rest of a web when one population changes. Trace it like falling dominoes, and give the reason for every change.
Tracing a knock-on effect
- Start with the species that changed, then move one link at a time.
- Its prey increase: fewer of them are eaten (less predation).
- Its predators decrease: they lose a food source (unless they have other prey).
- Predators may switch to other prey, which then decrease.
- Species that shared its food may increase: less competition.
- Then follow on: more herbivores means fewer producers (more grazing).
Remember it as: Name it, say up or down, say why.
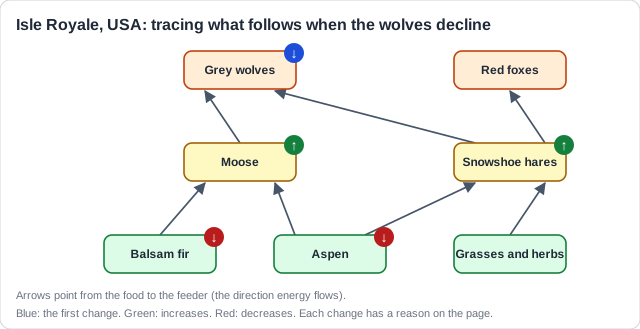
Real example: on Isle Royale, an island in Lake Superior, USA, the wolves dwindled to just two by 2016. With few predators the moose rose to about 2 000 and browsed young balsam fir so heavily that few could grow. From 2018 new wolves were brought in.
What does not score: 'Frogs increase' with no reason, or a reason with no change, is not enough: fewer herons, so frogs increase because fewer are eaten; then grasshoppers decrease because more frogs eat them. Use only the links in the figure. 'The food web collapses' or 'biodiversity falls' on its own does not count, and the same change for two species (sharks and marlin fall) counts once.
People change food webs every day. To score, link each activity to what it does in the web: which species goes up or down, and why.
The points to remember
- Hunting, trapping and fishing remove a species, so its predators lose food and its prey increase.
- Logging and trampling by visitors remove producers, the food at the base of the web.
- Introduced species, such as cats, add new predators or competitors.
- Protecting a predator, such as wolves, raises predation on the herbivores.
- Removing a dam drains the pond, so pond species that others eat are lost.
- Pesticides can kill the predators of a pest, so the pest booms.
Linked to the web
- Hunting moose leaves wolves less prey.
- Trampling kills plants, so herbivores lose food.
- Pet cats hunt the birds, so the birds' prey increase.
Not enough on its own
- 'Deforestation'
- 'Pollution' or 'agriculture'
- 'Habitat loss' with no feeding link
Real example: off Newfoundland, Canada, overfishing made the Atlantic cod collapse, and fishing was stopped in 1992. With fewer cod eating them, northern shrimp and snow crab increased greatly.
Activity, then effect: Write each way as one sentence: the activity, the species it removes or adds, and the change it causes in the web.
Learn what examiners really want
See exactly what to write to score full marks. Our AI shows you model answers and the key phrases examiners look for.
The more links a web has, the more ways energy can still reach each species when one food runs short. That is why complexity matters for stability and resilience.
The points to remember
- More links give predators alternative prey, so the loss of one species matters less.
- So a complex web is usually more stable and resilient.
- But a species with many links, or the only food of another, can still upset the whole web.
- During succession, webs get more complex: more species, more links, more trophic levels.
- Later webs pass on more energy and store more biomass at each level, with more decomposers.
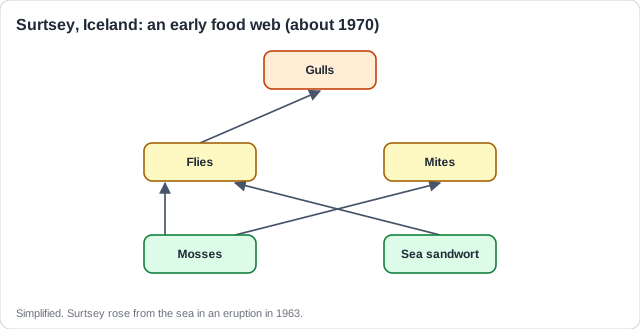
Remember it as: Older community, bigger web.
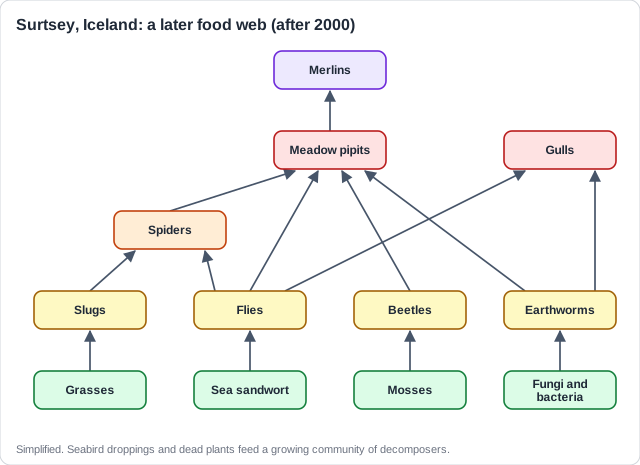
Real example: Surtsey, an island that rose from the sea off Iceland in 1963, began with bare lava. Gulls began nesting there in 1986, and their droppings fed the soil; by 2008 about 69 plant species grew there, with insects, spiders and birds feeding on them.
Complex is not always safe: Losing one species with many links can still upset a complex web: a keystone species is the extreme case (see 2.1.23).
How this comes up: Paper 1: a food web in the resource booklet. Outline the impact on other populations if one predator declines [2].
Figure 1 shows a simplified food web in the Serengeti, Tanzania.
Outline the impact that a reduction in the lion population may have on other populations in the food web shown in Figure 1.
Model answer plan
See the mark-by-mark plan — for / against / judgement, with marking guidance — in study mode.