Everything gained, minus the running costs: Gross productivity is the total gain in biomass by an organism. Some of it is used in cellular respiration. What is left is net productivity: the new biomass used for growth and reproduction, and the food for the next trophic level. Productivity is a rate: it shows how much new life an ecosystem makes, and most of it starts with producers, by photosynthesis.
The points to remember
- Gross productivity (GP): the total gain in biomass (or energy) by an organism or trophic level.
- Part of GP is used in cellular respiration and lost as heat: that is R.
- Net productivity (NP): what remains after respiration: NP = GP − R.
- For producers, GP is made by photosynthesis (gross and net primary productivity, GPP and NPP).
- For consumers, GP = food eaten − faeces: only the food absorbed counts.
- Productivity is a rate: per square metre per year, in kJ m⁻² yr⁻¹ or g m⁻² yr⁻¹.
- Only NP can be passed on: it is the food available to the next trophic level.
The formula: NP = GP − R
Gross = everything gained. Net = what is left after respiration.
Real example: in Cedar Bog Lake, Minnesota, the water plants and algae gained about 4 660 kJ per m² each year (GP). They respired about 980, so their NP was about 3 680 kJ m⁻² yr⁻¹.
Gross, not net: 'The total gain in biomass' is gross productivity. Net productivity is only what is left after respiration.
Free preview
This is the free notes preview
You're reading the free notes. Aimnova Pro unlocks the full study experience — and you can try it with your first topic free to keep:
- FlashcardsLock in vocabulary and key terms with spaced repetition.
- Practice questionsAnswer exam-style questions and get instant AI marking.
- Mock exams & past-paper vaultSit full mocks and see exactly how examiners award marks.
- Personalised study planA daily plan built around your exam date and weak areas.
Formula first: NP = GP − R, in kJ m⁻² yr⁻¹ (kilojoules per square metre per year) or g m⁻² yr⁻¹.
How to work it out
- Write the formula first: NP = GP − R.
- Substitute the values from the table or graph.
- Give the answer with units, e.g. kJ m⁻² yr⁻¹.
- Turn it round when you need to: GP = NP + R and R = GP − NP.
- Consumers: first GP = food eaten − faeces, then NP = GP − R.
- Share lost in respiration = R ÷ GP × 100.
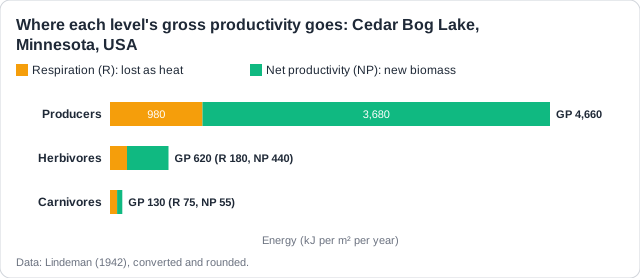
Worked example: Herbivores in Cedar Bog Lake: NP = GP − R = 620 − 180 = 440 kJ m⁻² yr⁻¹.
A caterpillar in a school lab eats 5.0 g (dry mass) of cabbage and passes 2.1 g of faeces in a week, and uses 2.2 g in respiration. GP = 5.0 − 2.1 = 2.9 g; NP = 2.9 − 2.2 = 0.7 g per week.
Faeces are not part of GP: they are food that passed straight through and was never absorbed.
Practice with real exam questions
Answer exam-style questions and get AI feedback that shows you exactly what examiners want to see in a full-marks response.
Producers and consumers both respire, but not by the same amount. Respiration takes a much bigger share of GP in consumers than in producers, because consumers are far more active.
The points to remember
- Producers do not move, so they use less of their GP in respiration.
- Consumers move to find food, hunt, escape, digest food and keep warm.
- All this activity needs energy from respiration, lost as heat.
- So consumers lose a bigger share of GP, and their NP is a smaller share.
- Birds and mammals, which keep their bodies warm, lose the most: often over 95%.
Remember it as: Moving, digesting, keeping warm: all paid for by respiration.
| Cedar Bog Lake | GP | R | Share of GP respired |
|---|---|---|---|
| Producers | 4 660 | 980 | 21% |
| Herbivores | 620 | 180 | 29% |
| Carnivores | 130 | 75 | 58% |
Real example: a field vole runs, digests grass and keeps its body warm day and night, so it respires almost all it absorbs; the grass it eats keeps about half of its GP as NP.
Give the reason: 'Consumers lose more energy' is not enough. Say why: movement, digestion and keeping warm all need respiration.
Why is GP high in some places and low in others? Producers make GP by photosynthesis, so GP is high where everything photosynthesis needs is plentiful.
The points to remember
- GP rises with the things photosynthesis needs: light, warmth, water, nutrients and CO₂.
- Light: more sunlight, longer days and a longer growing season mean more photosynthesis.
- Temperature: warmth speeds up photosynthesis; cold slows plant growth.
- Water: where water is not limiting, plants can grow quickly.
- Nutrients: nitrate and phosphate let plants and phytoplankton grow; warmth speeds decomposition, which recycles them.
- A climate graph: say it is warm and wet all year, then link that to photosynthesis all year.
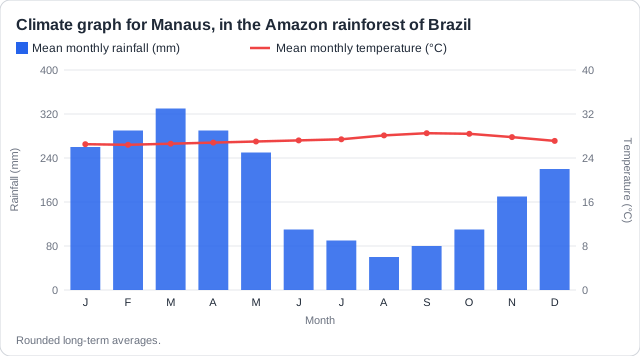
Real example: in Manaus, in the Amazon, it is about 27 °C in every month and rain falls every month, so the rainforest photosynthesises all year round; in the tundra plants can grow for only two or three months.
Two traps: 'More rain means more productivity' is not enough: link it to photosynthesis or plant growth. And on a climate graph, say the warmth and rain last all year; 'fertile soil' is not a reason you can read from it.
Feeling unprepared for exams?
Get a clear study plan, practice with real questions, and know exactly where you stand before exam day. No more guessing.
Some ecosystems are far more productive than others. The most productive ones have warmth, light, water and a steady supply of nutrients all at once.
The points to remember
- Tropical rainforests: warm and wet all year, so photosynthesis never stops.
- Estuaries: rivers and tides bring nutrients; shallow water is warm and sunlit; fresh and salt water mix.
- Upwelling coasts: cold, deep water rises and brings nutrients up to the sunlit surface.
- In the sea, most production is in the sunlit upper layer, the euphotic zone.
- More plant production means more energy for every level above it.
- Shallow nursery areas and no-fishing zones let young fish grow: more secondary productivity.
- Estuaries and reefs cover a small area, so they add only a little to global productivity.
Real example: Chesapeake Bay, USA, is an estuary. Rivers and tides bring nutrients, its shallow water is warm and sunlit, and it is a nursery for young fish and crabs.
Not biodiversity alone: 'High biodiversity' or 'complex food webs' alone does not explain high productivity. Name the cause: nutrients, light, warmth or mixing water.
To measure the productivity of producers, measure how much biomass (or oxygen) they gain with light, and how much they lose without it. The loss in the dark is respiration.
The points to remember
- Plots (on land): cut the plants in a set area, dry them to constant mass, and weigh.
- Repeat later: the gain in dry biomass per m² per year is the NP.
- A covered (dark) plot only respires: its loss in biomass is R, so GP = NP + R.
- Light and dark bottles (in water): measure dissolved oxygen at the start and after, e.g., a day.
- The rise in the light bottle = NP; the fall in the dark bottle = R; GP = NP + R.
Worked example: Pond water: oxygen rises by 6 mg per litre in the light bottle and falls by 2 in the dark bottle. NP = 6; R = 2; GP = 6 + 2 = 8 mg per litre per day.
| Method | Light and dark bottles | Open and covered plots |
|---|---|---|
| Where | Lakes, ponds, the sea | Grassland, crops, meadows |
| Strengths | Simple; water returned, nothing killed | Producers easy to separate |
| Limits | Consumers in the bottle respire too | Plants are killed; roots hard to collect |
| Also | Only the water sampled; needs a set temperature | Hard with trees; easier in simple systems |
Evaluate a method: Name the ecosystem, give the method in three steps, then strengths and limits. The drying step is on 2.2.16.
Memorize terms 3x faster
Smart flashcards show you cards right before you forget them. Perfect for definitions and key concepts.
Animals cannot be cut and weighed in a plot. To find the NP of an animal population, estimate how many there are and how heavy they are, at the start and end of a year.
The points to remember
- Population size: capture-mark-release-recapture and the Lincoln index.
- Weigh a sample of animals and convert to dry mass; find the mean dry mass of one animal.
- Numbers × mean dry mass = total biomass; do this at the start and end of a year.
- Measure the area (tape or map); NP = change in dry biomass ÷ area, e.g. kg m⁻² yr⁻¹.
- In a lab: GP = dry mass of food eaten − faeces; subtract respiration to get NP.
Count
Lincoln index: (M × N) ÷ R, see 2.1.17.
Weigh
Mean dry mass of one animal.
Repeat
Again a year later.
Divide
Change in biomass ÷ area.
Example: grasshoppers in a school meadow of 200 m²: 900 × 0.05 g = 45 g of dry biomass in spring, 1 600 × 0.05 g = 80 g a year later. NP = (80 − 45) ÷ 200 = 0.175 g m⁻² yr⁻¹.
GP of an animal: Weighing the animal gives NP. For GP, weigh the dry food eaten and the dry faeces: GP = food eaten − faeces.
People harvest living things: fish, timber, grass for cattle. The NP is the new biomass added each year, so it sets how much can be taken for ever. It is the natural income of the natural capital.
The points to remember
- The NP of an organism or trophic level is the most that can be harvested each year.
- Take no more than NP and the stock stays the same: the maximum sustainable yield.
- NP is the natural income; the stock itself is the natural capital.
- Take more than NP and the stock shrinks: the harvest cannot last.
- Limits: NP is hard to measure and varies from year to year; it only fits living resources.
- It ignores damage from harvesting (bycatch, roads) and the other species that need that NP.
Remember it as: Spend the interest, never the savings.
Real example: off Newfoundland, Canada, fleets caught more cod each year than the stock added. By 1992 the cod had collapsed, fishing was banned, and tens of thousands of people lost their jobs.
For a 'to what extent' question: Explain why NP works as a limit, then its weaknesses, each with a named resource, and end with a judgement.
Know your predicted grade
Take timed mock exams and get detailed feedback on every answer. See exactly where you're losing marks.
How this comes up: Paper 1: a chart or fact file on a productive place. Read a value [1], then outline why it is so productive [2-3]. Paper 2 Section B: a method [7] or sustainable harvesting [9].
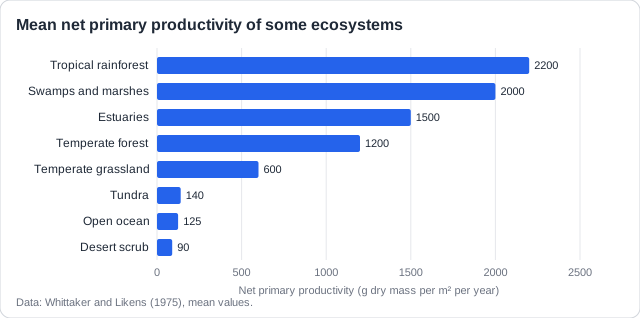
Figure 1 shows the mean net primary productivity of some ecosystems. Chesapeake Bay, on the east coast of the USA, is a large estuary.
Outline why estuaries are highly productive ecosystems.
Model answer plan
See the mark-by-mark plan — for / against / judgement, with marking guidance — in study mode.