Your way of life, as an area of land: An ecological footprint adds up all the land and water a population needs, measured in global hectares.
The points to remember
- An ecological footprint is the area of land and water a population needs.
- It is the area to provide all its resources, at the rate they are used.
- Plus the area to absorb all its wastes, at the rate they are produced.
- It is worked out for a specific population: a person, a city or a country.
- It is measured in global hectares (gha), often per person.
Remember it as: Footprint = the land to feed you + the land to clean up after you.
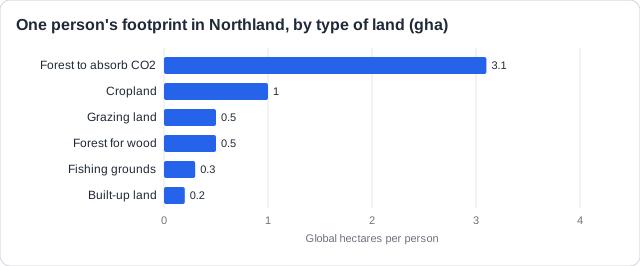
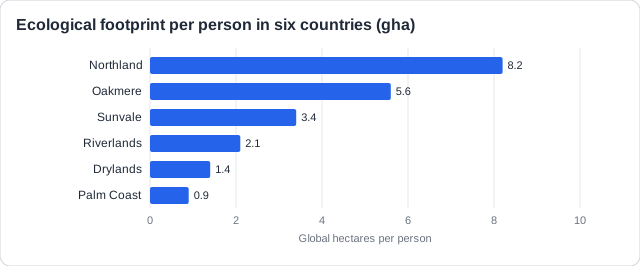
A real example: the average person in the United States has a footprint of about 8 gha; in India it is about 1 gha.
Try it: Use an online footprint calculator for your own footprint, then chart the class results.
Free preview
This is the free notes preview
You're reading the free notes. Aimnova Pro unlocks the full study experience — and you can try it with your first topic free to keep:
- FlashcardsLock in vocabulary and key terms with spaced repetition.
- Practice questionsAnswer exam-style questions and get instant AI marking.
- Mock exams & past-paper vaultSit full mocks and see exactly how examiners award marks.
- Personalised study planA daily plan built around your exam date and weak areas.
Too big for the land: If a footprint is bigger than the land and water available, the way of life cannot last: it is unsustainable.
The points to remember
- A footprint bigger than the area available means the population is unsustainable.
- It uses more resources than the land and sea can replace.
- It makes more waste than the land can absorb, so the environment is damaged.
- It survives only by importing resources or exporting waste to other places.
- The footprint is the reciprocal of carrying capacity.
- The same test works for carbon (more CO2 than plants absorb) and water (more than rain puts back) footprints.
A real example: Singapore has almost no farmland and imports over 90% of its food, so its footprint is far bigger than its own land.
Say exactly what goes wrong: 'It damages the environment' is too vague. Say what is overused or where the waste goes.
The area available is its biocapacity: above it is an ecological deficit, below it a reserve. A sustainable country has an HDI of 0.8 or more and a footprint below 1.6 gha, the Earth's biocapacity per person. As HDI rises, footprints usually rise too, so few countries meet both.
See how examiners mark answers
Access past paper questions with model answers. Learn exactly what earns marks and what doesn't.
Same planet, very different footprints: How much people consume, and how it is produced, decide the size of a footprint.
The points to remember
- Wealth: richer people buy more goods, energy and travel.
- Diet: meat needs far more land than crops.
- Energy: burning fossil fuels needs forest to absorb the CO2; renewables do not.
- Technology: efficient farms and factories need less land for the same output.
- Recycling laws, education and values cut waste and new resources.
- Location: cold places need heating; productive, rainy places need less land.
- Population size changes the total footprint, not the footprint per person.
Same food and energy, different footprints: a town with solar power and efficient farms needs less land than one burning coal.
Not a reason: 'Limited land' or 'high population density' do not explain a big footprint per person. Link each factor to more (or less) resource use or waste.
Footprints change: A footprint grows or shrinks as the number of people, and how they live, changes.
The points to remember
- It rises with more people, more wealth, more waste and more imports.
- It falls with less consumption, recycling, renewable energy and efficiency.
- A crisis can cut it quickly: the COVID-19 pandemic stopped travel and tourism in 2020.
- Check the axis: a total footprint can rise while the footprint per person falls.
- Always end with the link: so the footprint rises (or falls).
A real example: in 2020, as flights and factories stopped in the pandemic, humanity's footprint fell.
Through the demographic transition
- Stage 1 of the demographic transition model: small, few people growing their own food.
- Stages 2-3: rises as the population and farming grow.
- Industrialisation: rises steeply with heavy use of fossil fuels.
- Later stages: may level off or fall with slower growth and cleaner technology, or keep rising with consumerism.
Per person or total?: Total footprint = footprint per person x population. It can rise while each person's footprint falls.
Study smarter, not longer
Most students waste 40% of study time on topics they already know. Our AI tracks your progress and optimizes every minute.
Turning a lifestyle into an area: A footprint is worked out by converting everything used and thrown away into the land needed to supply and absorb it.
The four steps
- Measure what the population consumes: food, water and energy.
- Measure the waste it produces, including carbon dioxide.
- Find the productivity of the land: how much each hectare produces and absorbs.
- Area = (consumption + waste) / productivity; for a per-person figure, multiply by the population for the total.
A real example: a footprint calculator asks about your food, travel, home energy and shopping, then does these steps for you.
Remember it as: Use, waste, productivity, divide.
A useful model, not a perfect one: The footprint is a model: it simplifies a complicated world into one number.
The points to remember
- Strengths: easy to understand, easy to compare, raises awareness, covers resources and waste.
- Limits: a simplified estimate; leaves out some impacts; shows only a total.
- End an evaluation with a judgement and the reason for it.
Strengths
- A quick snapshot of whether a lifestyle is sustainable.
- Easy for non-specialists to understand.
- Places and people are easy to compare.
- An iconic image that raises awareness.
- Can guide government policy; estimates carrying capacity.
Limits
- Leaves out some impacts, such as toxic pollution.
- Simplified: figures are estimates.
- Land often has more than one use.
- Shows the total, not which resources.
- Less reliable locally; a negative message can demotivate.
What does not score: A definition is not a strength. Nor are 'it shows if a country is sustainable', 'it is simple', 'it is inaccurate' on its own, or 'it ignores change over time'.
Practice with real exam questions
Answer exam-style questions and get AI feedback that shows you exactly what examiners want to see in a full-marks response.
Shrinking a footprint: Pollution can be managed at three levels, and each changes the footprint differently.
The points to remember
- Change the activity (less driving, renewables, less meat): cuts the footprint most.
- Control the release (filters, scrubbers): the fuel is still burned.
- Clean up and restore: needs energy and machines, so it can add to the footprint at first.
- Restored forests and wetlands become carbon sinks, helping later.
- One person can shrink theirs: eat less meat, cycle or take the bus, buy less, recycle.
A real example: Copenhagen built safe cycle lanes across the city; a large share of its people now cycle to work, burning no fuel.
Remember it as: Prevent first, filter second, clean up last.
Evaluating a strategy: give a plus and a minus. Cutting consumption tackles the cause, but it can be unpopular and may slow development in poorer countries; clean-up is often costly.
How this comes up: Paper 1: a graph of a footprint over time; outline why it changed [2]. Tamarin Island is the example.
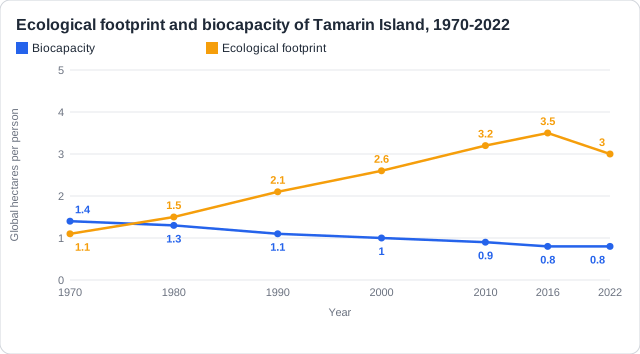
Figure 1 shows the ecological footprint and biocapacity of Tamarin Island between 1970 and 2022. Its population and tourism grew for decades until the pandemic closed its borders in 2020.
Outline why the ecological footprint of Tamarin Island has changed over time, as shown in Figure 1.
Model answer plan
See the mark-by-mark plan — for / against / judgement, with marking guidance — in study mode.