Rural-urban migration at Higher Level: The same ideas as SL, with China as the case: hundreds of millions of internal migrants, the hukou system and forced moves for a dam. At HL, expect data questions: read a graph, calculate a depopulation rate, estimate.
Practise this as you read
- Explain migration with push and pull factors.
- Calculate and estimate from urban and rural data.
Free preview
This is the free notes preview
You're reading the free notes. Aimnova Pro unlocks the full study experience — and you can try it with your first topic free to keep:
- FlashcardsLock in vocabulary and key terms with spaced repetition.
- Practice questionsAnswer exam-style questions and get instant AI marking.
- Mock exams & past-paper vaultSit full mocks and see exactly how examiners award marks.
- Personalised study planA daily plan built around your exam date and weak areas.
From village to city: Rural-urban migration is why most people now live in urban areas, and why that share keeps rising.
The points to remember
- Rural-urban migration: people moving from the countryside to towns and cities.
- Because of it, a greater proportion of people now live in urban rather than rural areas.
- The world's urban population overtook the rural population in 2007.
- The urban share is still increasing: about 58% in 2025.
- Most rural-urban migration is internal: within one country.
Real example: in 2020 China counted about 376 million people living away from their registered home, most of them rural people working in cities: the largest internal migration in history.
Get feedback like a real examiner
Submit your answers and get instant feedback — what you did well, what's missing, and exactly what to write to score full marks.
People move because of what pushes them away from the countryside and what pulls them towards the city.
Push and pull factors
- Push factors drive people out of rural areas; pull factors draw them to cities.
- Push: few jobs, low farm incomes, mechanisation replacing farm workers.
- Push: drought, famine, crop failure, land degradation, conflict, poor services.
- Pull: jobs and higher wages, education, healthcare, better services and infrastructure.
- Pull: friends and relatives already there, social benefits, a perceived better life.
- Higher birth rates or lower death rates are not reasons for migration.
Push (leave rural)
- Few jobs, low farm incomes
- Mechanisation
- Drought, famine, land degradation
- Conflict, poor services
Pull (go to the city)
- Jobs, higher wages
- Schools, hospitals
- Friends and relatives
- A perceived better life
Real example: from the 1980s, factories on China's coast paid far more than farming in inland provinces such as Sichuan, while machines and small plots left farmers with little work: pull and push together.
Migration reasons only: Asked why a city's population grew through migration? Higher birth rates or lower death rates do not count: give push or pull factors.
Not every migrant chooses to move. The difference between forced and voluntary migration is choice.
Forced or voluntary
- Voluntary migration: people choose to move, usually for jobs or education.
- Forced migration: people have no choice: conflict, disaster, eviction, loss of land.
- Many moves mix both: a drought makes farming fail, so leaving is hardly a free choice.
- Governments can force moves too, for example to clear land for a dam.
Voluntary
- A choice
- For jobs, education, family
- Often planned
Forced
- No real choice
- Conflict, disaster, eviction
- Often sudden
Real example: to build the Three Gorges Dam, China moved about 1.3 million people from the Yangtze valley between the 1990s and 2008: a forced move, many of them into new towns. Factory workers who chose to go to Shenzhen moved voluntarily.
Remember it as: Voluntary = chose to go. Forced = had to go.
Learn what examiners really want
See exactly what to write to score full marks. Our AI shows you model answers and the key phrases examiners look for.
Migrants move for a better life. Some of what they expect is real; some is only perceived.
Perceived or real advantages
- Migrants move for the advantages they expect: jobs, wages, schools, hospitals, a better life.
- Some are real: on average city incomes, schooling and healthcare are better.
- Some are only perceived: many find informal jobs with low, insecure pay.
- Housing is often an informal settlement with poor water and sanitation.
- Many still send money home, so rural families gain too.
Expected
- A steady job
- A good home
- Schools and hospitals
Often found
- Informal, low-paid work
- A crowded informal settlement
- Services too few or too far
Real example: under China's hukou, migrants long had poorer access to city schools and hospitals. Reforms since 2014 have eased this in smaller cities.
Within one country, rural-urban migration follows a pattern over time, and in richer countries it can partly reverse.
The trend within a country, and deurbanization
- Within a country, rural-urban migration is fast at first, then slows once most people are urban.
- The rural population may fall for decades: rural depopulation.
- Deurbanization: people leave big cities for suburbs, small towns or the countryside.
- Reasons: jobs leaving the city, cheaper housing, more space, retirement, working from home.
- Depopulation rate = (start - end) ÷ start × 1000 (per 1000), or × 100 for %.
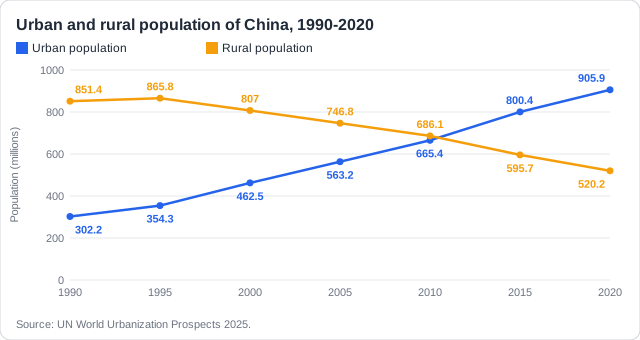
Calculate a depopulation rate: China's rural population fell from 807.0 million (2000) to 686.1 million (2010). Rate = (807.0 - 686.1) ÷ 807.0 × 1000 = 150 per 1000 (15%). Never give a negative answer.
Real example: South Korea's rural population fell from about 20 million in the 1960s to 8.8 million in 2010, then rose to about 9.8 million by 2020 as some city people moved to the countryside to farm or retire: deurbanization.
Never wonder what to study next
Get a personalized daily plan based on your exam date, progress, and weak areas. We'll tell you exactly what to review each day.
How this comes up: Paper 1: a graph of urban and rural populations, then four short parts: read a year, read a value, calculate a depopulation rate, estimate the future (May 2026).
Figure 1 shows the urban and rural populations of China.
(a) Identify the first year shown in which the rural population was below 700 million. (b) State the urban population in that year. (c) Calculate the rate of rural depopulation between 2000 and 2020. (d) If the 2010-2020 decline continues, estimate the rural population in 2030, to the nearest 5 million.
Model answer plan
See the mark-by-mark plan — for / against / judgement, with marking guidance — in study mode.