Diets and trophic levels, at Higher Level: Different examples from SL: tempeh, the crops fed to animals, lamb against tofu, China's guidelines, Brazil's Cerrado and Mongolia's herders. At HL, read emissions by stage of the supply chain and weigh whether a diet shift is fair to herders (ethics); the sustainability of whole diets and food miles is 5.2.17.
Practise this as you read
- Calculate a share of a food's emissions from a stacked bar chart.
- Outline why one food releases more greenhouse gases than another.
Free preview
This is the free notes preview
You're reading the free notes. Aimnova Pro unlocks the full study experience — and you can try it with your first topic free to keep:
- FlashcardsLock in vocabulary and key terms with spaced repetition.
- Practice questionsAnswer exam-style questions and get instant AI marking.
- Mock exams & past-paper vaultSit full mocks and see exactly how examiners award marks.
- Personalised study planA daily plan built around your exam date and weak areas.
We can eat at any level: Humans are omnivorous. Our diets include fungi, plants, meat and fish, so we can feed low or high in the food chain.
The points to remember
- Eating plants (rice, beans, fruit) puts us at trophic level 2, as primary consumers.
- Eating plant-eating animals (beef, lamb, milk) puts us at level 3.
- Eating predatory fish such as tuna puts us at level 4 or higher.
- Fungi (mushrooms, yeast) are decomposers, not plants, but they feed on plant material.
- Diets differ with climate, water, culture and religion, wealth, technology and values.
Example (HL): tempeh. In Indonesia, tempeh is made by letting a mould grow through cooked soya beans until they bind into a firm cake. It is a fungus-and-plant protein eaten at trophic level 2.
Practice with exam-style questions
Answer exam-style questions and get AI feedback that shows you exactly what examiners want to see in a full-marks response.
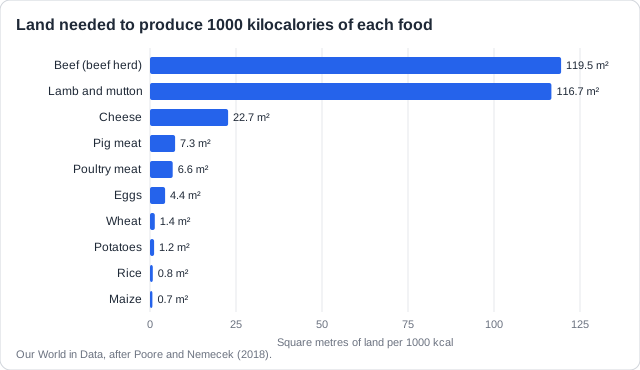
Only about 10% of the energy at one trophic level passes to the next. The rest is used in respiration, lost as heat, or never eaten. So feeding crops to animals, then eating the animals, wastes most of the crop's energy.
The points to remember
- Shorter food chain = less energy lost = more food per hectare.
- Crops give a greater quantity of food from the same land than livestock.
- So crop foods are usually lower in cost per kilocalorie or per gram of protein.
- Lower land need means less habitat cleared for farming.
- Farming crops on land, rather than catching wild fish, is easier and safer to harvest, lets people choose what to grow and eases overfishing.
Remember it as: Eat lower, feed more: every step up the chain loses about 90%.
Example (HL): feed crops. A 2013 study (Cassidy and others) found that about 36% of the calories grown on the world's cropland are fed to animals, and only about 12% of those come back as meat, milk and eggs. Eating those crops directly could feed about 4 billion more people.
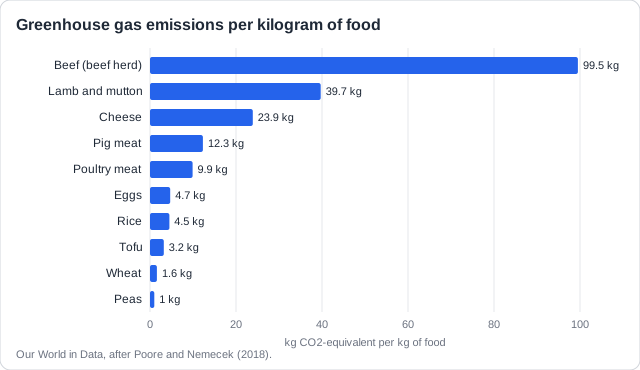
Animal foods also release far more greenhouse gases per kilogram. Gases are added up as CO2-equivalent.
The points to remember
- Cattle and sheep are ruminants: their digestion releases methane.
- Pasture and feed crops need more land, so forests are cleared and stored carbon becomes CO2.
- Feed crops need fertilizer, which releases nitrous oxide (N2O).
- Raising, processing and chilling animal foods uses more fossil fuel energy.
- Manure decomposing releases methane and N2O. Growing plants also absorb CO2.
Not a reason: 'People demand more beef' and 'animals breathe out CO2' do not explain the higher emissions. Name a source: methane, cleared land, fertilizer, energy or manure.
The gases: carbon dioxide, methane, nitrous oxide, water vapour. Not 'NOx' and not carbon monoxide.
Example (HL): lamb v tofu. For the same 100 g of protein, lamb releases about 19.9 kg CO2-equivalent and tofu about 2 kg, ten times less.
Feeling unprepared for exams?
Get a clear study plan, practice with real questions, and know exactly where you stand before exam day. No more guessing.
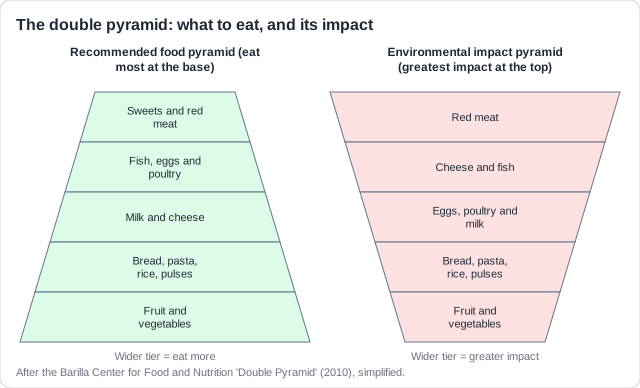
The double pyramid puts a healthy-eating pyramid beside an environmental impact pyramid drawn upside down. Read them together.
The points to remember
- The pyramids are inverse: the foods recommended most have the lowest impact.
- Foods at the top of both are mostly higher trophic levels (meat, cheese).
- Foods at the base are producers: fruit, vegetables, grains.
- More high-impact food increases the ecological footprint: more land, energy, water, methane, and overgrazing.
Say the direction: When asked how high-impact foods affect the ecological footprint, first say it gets bigger, then why.
Example (HL): China. China's 2016 dietary guidelines advised eating only 40-75 g of meat a day, well below the amount many city dwellers ate.
Meat eaten per person rises as people get richer. That change spreads out through whole ecosystems.
The points to remember
- More meat = more pasture and feed crops = habitat loss, the biggest threat to biodiversity.
- Manure and fertilizer run off into rivers: eutrophication.
- More methane, CO2 and N2O add to climate change, which shifts and shrinks habitats.
- Less meat frees land that can be restored to forest or grassland.
- Impacts can be reduced by better farming: buffer strips, less fertilizer, no new clearing.
Example (HL): Brazil's Cerrado. Much of this species-rich savanna has been cleared for soya, most of it fed to pigs and chickens in China and Europe.
Memorize terms 3x faster
Smart flashcards show you cards right before you forget them. Perfect for definitions and key concepts.
To what extent could plant-based diets make farming more sustainable? Weigh both sides.
Yes: a big gain
- Farmland could shrink by about 75% (4.1 to 1 billion hectares).
- Far lower emissions, less fertilizer and water.
- Freed land could be rewilded, helping biodiversity.
- Crop foods are cheaper, so more people can afford enough.
But: limits
- Much grazing land is too dry, steep or cold for crops.
- Animals give income and culture to herders.
- Meat gives iron, B12, protein in poor diets.
- Crops still have impacts: rice methane, fertilizer, pesticides.
The points to remember
- Plant-based diets cut land, emissions and cost the most of any single change.
- They work best where crops can grow and food is plentiful.
- On land only animals can use, some livestock can still be sustainable.
- Judgement: a big shift towards plants, not a ban on all meat.
Example (HL): Mongolia. Most of Mongolia is cold, dry grassland where crops fail. Herders have lived from sheep, goats, horses and yaks for thousands of years.
How this comes up: HL Paper 2 can give stacked bars of emissions at each stage of the supply chain and ask you to calculate a share [1], distinguish two foods [2] or explain a difference [2].
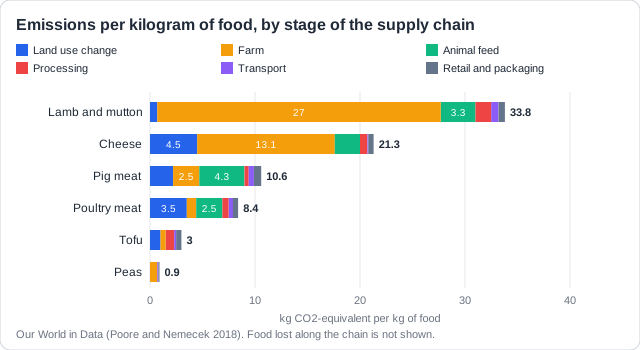
The chart shows the greenhouse gas emissions for each kilogram of six foods, split by stage of the supply chain.
Outline two reasons why lamb produces more greenhouse gas emissions per kilogram than poultry meat.
Model answer plan
See the mark-by-mark plan — for / against / judgement, with marking guidance — in study mode.