Measuring water stress at Higher Level: This statement is Higher Level only. You learn the number that defines water stress, 1,700 cubic metres per person per year, and explain why one named society falls below it.
Practise this as you read
- Calculate water per person from data.
- Explain why India falls below 1,700.
Free preview
This is the free notes preview
You're reading the free notes. Aimnova Pro unlocks the full study experience — and you can try it with your first topic free to keep:
- FlashcardsLock in vocabulary and key terms with spaced repetition.
- Practice questionsAnswer exam-style questions and get instant AI marking.
- Mock exams & past-paper vaultSit full mocks and see exactly how examiners award marks.
- Personalised study planA daily plan built around your exam date and weak areas.
A number for water stress: Water stress is measured as water per person. If each person has less than 1,700 cubic metres of clean, accessible water a year, the society is water stressed.
The 1,700 cubic metre line
- A society is water stressed when its clean, accessible water is below 1,700 cubic metres per person per year.
- Per person (per capita): divide the renewable water by the population.
- Only clean and accessible water counts, not polluted or unreachable water.
- Below 1,000 cubic metres is water scarcity; below 500 is absolute scarcity.
- One cubic metre is 1,000 litres; the total covers farming, industry and homes, not just drinking.
| Water per person per year | Classed as |
|---|---|
| 1,700 cubic metres or more | No water stress |
| Below 1,700 | Water stress |
| Below 1,000 | Water scarcity |
| Below 500 | Absolute water scarcity |
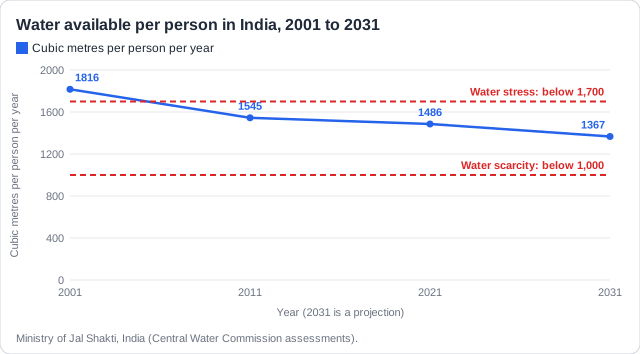
Real example: in 2011 India had about 1,869 cubic kilometres of water a year on average and about 1.21 billion people. 1,869 billion cubic metres divided by 1.21 billion people is about 1,545 cubic metres each, below 1,700, so India is water stressed.
Never wonder what to study next
Get a personalized daily plan based on your exam date, progress, and weak areas. We'll tell you exactly what to review each day.
India crossed the 1,700 line between 2001 and 2011, and its water per person is still falling.
Why India is below 1,700
- Population growth: the same water shared by more people (1.03 billion in 2001, 1.21 billion in 2011).
- Rain in a few months: about three-quarters falls in the June to September monsoon, and much runs off.
- Groundwater over-pumped for irrigation: India takes about a quarter of all groundwater pumped worldwide.
- Pollution: sewage and factory waste make rivers such as the Yamuna in Delhi unsafe.
- Uneven spread: the wet north-east has plenty; dry states such as Rajasthan have little.
Remember it as: More people, short monsoon, wells run down, dirty rivers, uneven spread.
Real example: in Punjab, farmers pump groundwater with cheap electricity to grow rice, a very thirsty crop. Water tables there have fallen year after year, so wells must be dug deeper.
The 1,700 line is simple and easy to compare, but one number per country hides a lot.
Limits of the measure
- A national average hides dry regions and poor households inside a country.
- It is yearly: a wet season can hide months with almost no water.
- Measuring how much water is truly clean and accessible is hard, so figures are estimates.
- It ignores virtual water: a country can import food grown with other countries' water.
- It ignores demand: 1,500 cubic metres is plenty for a city, less for a farming region.
Strengths
- One clear number
- Easy to compare countries and years
- Shows the trend as population grows
Limits
- An average hides dry regions
- Hides dry months
- Ignores virtual water and demand
Real example: India's average of about 1,486 cubic metres in 2021 hides huge differences: the Brahmaputra basin in the north-east is very wet, while much of Rajasthan is desert.
Stop wasting time on topics you know
Our AI identifies your weak areas and focuses your study time where it matters. No more overstudying easy topics.
How this comes up: Paper 2, Section A: calculate water per person from data and say if it is below 1,700. Section B: (a) [4] outline why a named society is below the line; (b) [7] evaluate the measure.
India's water available per person fell from 1,816 cubic metres in 2001 to 1,486 cubic metres in 2021.
Outline the reasons why a named society has a water supply below 1,700 cubic metres per person per year.
Model answer plan
See the mark-by-mark plan — for / against / judgement, with marking guidance — in study mode.